Notetaking & Organization
Thorough notetaking is critical during any assessment. Our notes, accompanied by tool and log output, are the raw inputs to our draft report, which is typically the only portion of our assessment that our client sees. Even though we usually keep our notes for ourselves, we must keep things organized and develop a repeatable process to save time and facilitate the reporting process. Detailed notes are also a must in the event of a network issue or client question (i.e., did you scan X host on Y day?), so being overly verbose in our notetaking never hurts. Everyone will have their own style they are comfortable with and should work with their preferred tools and organizational structure to ensure the best possible results. In this module, we will cover the minimum elements that, from our professional experience, should be noted down during an assessment (or even while working through a large module, playing a box on HTB, or taking an exam) to save time and energy come reporting time or as a reference guide down the road. If you're part of a larger team where someone may have to cover a client meeting for you, clear and consistent notes are essential to ensure your teammate can speak confidently and accurately about what activities were and were not performed.
Notetaking Sample Structure
There is no universal solution or structure for notetaking as each project and tester is different. The structure below is what we have found to be helpful but should be adapted to your personal workflow, project type, and the specific circumstances you encountered during your project. For example, some of these categories may not be applicable for an application-focused assessment and may even warrant additional categories not listed here.
- Attack Path - An outline of the entire path if you gain a foothold during an external penetration test or compromise one or more hosts (or the AD domain) during an internal penetration test. Outline the path as closely as possible using screenshots and command output will make it easier to paste into the report later and only need to worry about formatting.
- Credentials - A centralized place to keep your compromised credentials and secrets as you go along.
- Findings - We recommend creating a subfolder for each finding and then writing our narrative and saving it in the folder along with any evidence (screenshots, command output). It is also worth keeping a section in your notetaking tool for recording findings information to help organize them for the report.
- Vulnerability Scan Research - A section to take notes on things you've researched and tried with your vulnerability scans (so you don't end up redoing work you already did).
- Service Enumeration Research - A section to take notes on which services you've investigated, failed exploitation attempts, promising vulnerabilities/misconfigurations, etc.
- Web Application Research - A section to note down interesting web applications found through various methods, such as subdomain brute-forcing. It's always good to perform thorough subdomain enumeration externally, scan for common web ports on internal assessments, and run a tool such as Aquatone or EyeWitness to screenshot all applications. As you review the screenshot report, note down applications of interest, common/default credential pairs you tried, etc.
- AD Enumeration Research - A section for showing, step-by-step, what Active Directory enumeration you've already performed. Note down any areas of interest you need to run down later in the assessment.
- OSINT - A section to keep track of interesting information you've collected via OSINT, if applicable to the engagement.
- Administrative Information - Some people may find it helpful to have a centralized location to store contact information for other project stakeholders like Project Managers (PMs) or client Points of Contact (POCs), unique objectives/flags defined in the Rules of Engagement (RoE), and other items that you find yourself often referencing throughout the project. It can also be used as a running to-do list. As ideas pop up for testing that you need to perform or want to try but don't have time for, be diligent about writing them down here so you can come back to them later.
- Scoping Information - Here, we can store information about in-scope IP addresses/CIDR ranges, web application URLs, and any credentials for web applications, VPN, or AD provided by the client. It could also include anything else pertinent to the scope of the assessment so we don't have to keep re-opening scope information and ensure that we don't stray from the scope of the assessment.
- Activity Log - High-level tracking of everything you did during the assessment for possible event correlation.
- Payload Log - Similar to the activity log, tracking the payloads you're using (and a file hash for anything uploaded and the upload location) in a client environment is critical. More on this later.
Notetaking Tools
There are many tools available for notetaking, and the choice is very much personal preference. Here are some of the options available:
As a team, we've had many discussions about the pros and cons of various notetaking tools. One key factor is distinguishing between local and cloud solutions before choosing a tool. A cloud solution is likely acceptable for training courses, CTFs, labs, etc., but once we get into engagements and managing client data, we must be more careful with the solution we choose. Your company will likely have some sort of policy or contractual obligations around data storage, so it is best to consult with your manager or team lead on whether or not using a specific notetaking tool is permitted. Obsidian is an excellent solution for local storage, and Outline is great for the cloud but also has a Self-hosted version. Both tools can be exported to Markdown and imported into any other tool that accepts this convenient format.
Obsidian
Again, tools are personal preferences from person to person. Requirements typically vary from company to company, so experiment with different options and find one that you are comfortable with and practice with different setups and formats while working through Academy modules, HTB boxes, Pro Labs, and other pieces of training to get comfortable with your notetaking style while remaining as thorough as possible.
Logging
It is essential that we log all scanning and attack attempts and keep raw tool output wherever possible. This will greatly help us come reporting time. Though our notes should be clear and extensive, we may miss something, and having our logs to fallback can help us when either adding more evidence to a report or responding to a client question.
Exploitation Attempts
Tmux logging is an excellent choice for terminal logging, and we should absolutely be using Tmux along with logging as this will save every single thing that we type into a Tmux pane to a log file. It is also essential to keep track of exploitation attempts in case the client needs to correlate events later on (or in a situation where there are very few findings and they have questions about the work performed). It is supremely embarrassing if you cannot produce this information, and it can make you look inexperienced and unprofessional as a penetration tester. It can also be a good practice to keep track of things you tried during the assessment but did not work. This is especially useful for those instances in which we have little to no findings in your report. In this case, we can write up a narrative of the types of testing performed, so the reader can understand the kinds of things they are adequately protected against. We can set up Tmux logging on our system as follows:
First, clone the Tmux Plugin Manager repo to our home directory (in our case /home/htb-student or just ~).
Notetaking & Organization
sasorirose@htb[/htb]$ git clone https://github.com/tmux-plugins/tpm ~/.tmux/plugins/tpmNext, create a .tmux.conf file in the home directory.
Notetaking & Organization
sasorirose@htb[/htb]$ touch .tmux.confThe config file should have the following contents:
Notetaking & Organization
sasorirose@htb[/htb]$ cat .tmux.conf# List of pluginsset -g @plugin 'tmux-plugins/tpm'
set -g @plugin 'tmux-plugins/tmux-sensible'
set -g @plugin 'tmux-plugins/tmux-logging'

# Initialize TMUX plugin manager (keep at bottom)run '~/.tmux/plugins/tpm/tpm'
After creating this config file, we need to execute it in our current session, so the settings in the .tmux.conf file take effect. We can do this with the source command.
Notetaking & Organization
sasorirose@htb[/htb]$ tmux source ~/.tmux.confNext, we can start a new Tmux session (i.e., tmux new -s setup).
Once in the session, type [Ctrl] + [B] and then hit [Shift] + [I] (or prefix + [Shift] + [I] if you are not using the default prefix key), and the plugin will install (this could take around 5 seconds to complete).
Once the plugin is installed, start logging the current session (or pane) by typing [Ctrl] + [B] followed by [Shift] + [P] (prefix + [Shift] + [P]) to begin logging. If all went as planned, the bottom of the window will show that logging is enabled and the output file. To stop logging, repeat the prefix + [Shift] + [P] key combo or type exit to kill the session. Note that the log file will only be populated once you either stop logging or exit the Tmux session.
Once logging is complete, you can find all commands and output in the associated log file. See the demo below for a short visual on starting and stopping Tmux logging and viewing the results.
If we forget to enable Tmux logging and are deep into a project, we can perform retroactive logging by typing [Ctrl] + [B] and then hitting [Alt] + [Shift] + [P] (prefix + [Alt] + [Shift] + [P]), and the entire pane will be saved. The amount of saved data depends on the Tmux history-limit or the number of lines kept in the Tmux scrollback buffer. If this is left at the default value and we try to perform retroactive logging, we will most likely lose data from earlier in the assessment. To safeguard against this situation, we can add the following lines to the .tmux.conf file (adjusting the number of lines as we please):
Tmux.conf
Notetaking & Organization
set -g history-limit 50000
Another handy trick is the ability to take a screen capture of the current Tmux window or an individual pane. Let's say we are working with a split window (2 panes), one with Responder and one with ntlmrelayx.py. If we attempt to copy/paste the output from one pane, we will grab data from the other pane along with it, which will look very messy and require cleanup. We can avoid this by taking a screen capture as follows: [Ctrl] + [B] followed by [Alt] + [P] (prefix + [Alt] + [P]). Let's see a quick demo.
Here we can see we're working with two panes. If we try to copy text from one pane, we'll grab text from the other pane, which would make a mess of the output. But, with Tmux logging enabled, we can take a capture of the pane and output it neatly to a file.
To recreate the above example first start a new tmux session: tmux new -s sessionname. Once in the session type [Ctrl] + [B] + [Shift] + [%] (prefix + [Shift] + [%]) to split the panes vertically (replace the [%] with ["] to do a horizontal split). We can then move from pane to pane by typing [Ctrl] + [B] + [O] (prefix + [O]).
Finally, we can clear the pane history by typing [Ctrl] + [B] followed by [Alt] + [C] (prefix + [Alt] + [C]).
There are many other things we can do with Tmux, customizations we can do with Tmux logging (i.e. changing the default logging path, changing key bindings, running multiple windows within sessions and panes within those windows, etc). It is worth reading up on all the capabilities that Tmux offers and finding out how the tool best fits your workflow. Finally, here are some additional plugins that we like:
- tmux-sessionist - Gives us the ability to manipulate Tmux sessions from within a session: switching to another session, creating a new named session, killing a session without detaching Tmux, promote the current pane to a new session, and more.
- tmux-pain-control - A plugin for controlling panes and providing more intuitive key bindings for moving around, resizing, and splitting panes.
- tmux-resurrect - This extremely handy plugin allows us to restore our Tmux environment after our host restarts. Some features include restoring all sessions, windows, panes, and their order, restoring running programs in a pane, restoring Vim sessions, and more.
Check out the complete tmux plugins list to see if others would fit nicely into your workflow. For more on Tmux, check out this excellent video by Ippsec and this cheat sheet based on the video.
Artifacts Left Behind
At a minimum, we should be tracking when a payload was used, which host it was used on, what file path it was placed in on the target, and whether it was cleaned up or needs to be cleaned up by the client. A file hash is also recommended for ease of searching on the client's part. It's best practice to provide this information even if we delete any web shells, payloads, or tools.
Account Creation/System Modifications
If we create accounts or modify system settings, it should be evident that we need to track those things in case we cannot revert them once the assessment is complete. Some examples of this include:
- IP address of the host(s)/hostname(s) where the change was made
- Timestamp of the change
- Description of the change
- Location on the host(s) where the change was made
- Name of the application or service that was tampered with
- Name of the account (if you created one) and perhaps the password in case you are required to surrender it
It should go without saying, but as a professional and to prevent creating enemies out of the infrastructure team, you should get written approval from the client before making these types of system modifications or doing any sort of testing that might cause an issue with system stability or availability. This can typically be ironed out during the project kickoff call to determine the threshold beyond which the client is willing to tolerate without being notified.
Evidence
No matter the assessment type, our client (typically) does not care about the cool exploit chains we pull off or how easily we "pwned" their network. Ultimately, they are paying for the report deliverable, which should clearly communicate the issues discovered and evidence that can be used for validation and reproduction. Without clear evidence, it can be challenging for internal security teams, sysadmins, devs, etc., to reproduce our work while working to implement a fix or even to understand the nature of the issue.
What to Capture
As we know, each finding will need to have evidence. It may also be prudent to collect evidence of tests that were performed that were unsuccessful in case the client questions your thoroughness. If you're working on the command line, Tmux logs may be sufficient evidence to paste into the report as literal terminal output, but they can be horribly formatted. For this reason, capturing your terminal output for significant steps as you go along and tracking that separately alongside your findings is a good idea. For everything else, screenshots should be taken.
Storage
Much like with our notetaking structure, it's a good idea to come up with a framework for how we organize the data collected during an assessment. This may seem like overkill on smaller assessments, but if we're testing in a large environment and don't have a structured way to keep track of things, we're going to end up forgetting something, violating the rules of engagement, and probably doing things more than once which can be a huge time waster, especially during a time-boxed assessment. Below is a suggested baseline folder structure, but you may need to adapt it accordingly depending on the type of assessment you're performing or unique circumstances.
- Admin
- Deliverables
- Evidence
- Retest
It's a good idea to have scripts and tricks for setting up at the beginning of an assessment. We could take the following command to make our directories and subdirectories and adapt it further.
Notetaking & Organization
sasorirose@htb[/htb]$ mkdir -p ACME-IPT/{Admin,Deliverables,Evidence/{Findings,Scans/{Vuln,Service,Web,'AD Enumeration'},Notes,OSINT,Wireless,'Logging output','Misc Files'},Retest}Notetaking & Organization
sasorirose@htb[/htb]$ tree ACME-IPT/ACME-IPT/
├── Admin
├── Deliverables
├── Evidence
│   ├── Findings
│   ├── Logging output
│   ├── Misc Files
│   ├── Notes
│   ├── OSINT
│   ├── Scans
│   │   ├── AD Enumeration
│   │   ├── Service
│   │   ├── Vuln
│   │   └── Web
│   └── Wireless
└── Retest
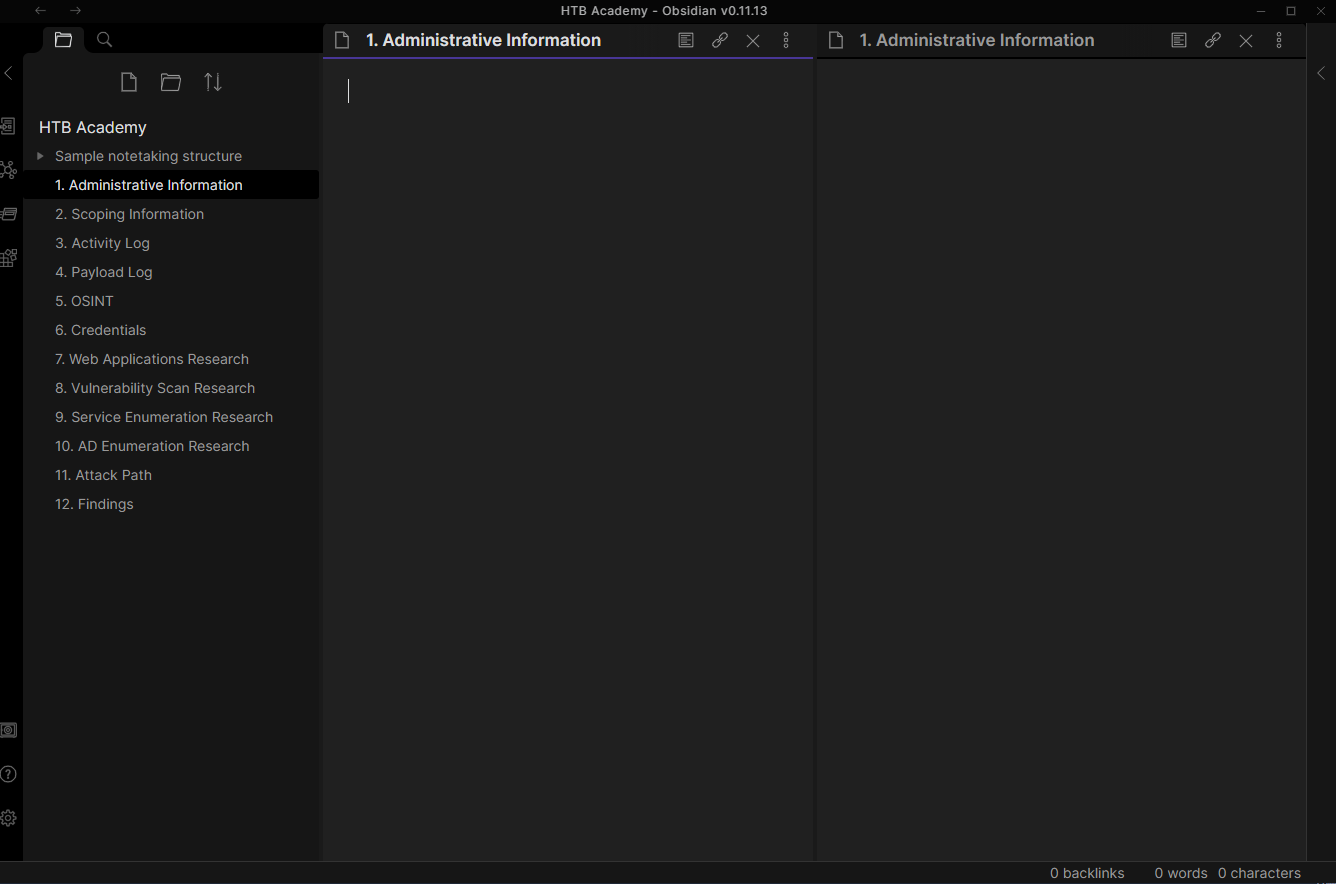
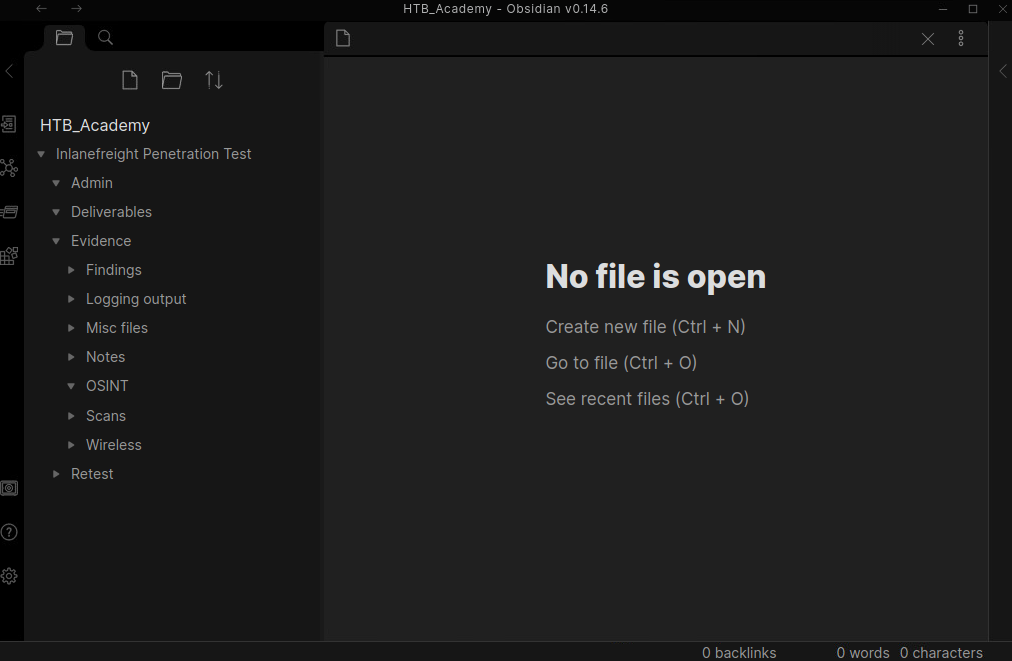
A nice feature of a tool such as Obsidian is that we can combine our folder structure and notetaking structure. This way, we can interact with the notes/folders directly from the command line or inside the Obsidian tool. Here we can see the general folder structure working through Obsidian.
Drilling down further, we can see the benefits of combining our notetaking and folder structure. During a real assessment, we may add additional pages/folders or remove some, a page and a folder for each finding, etc.
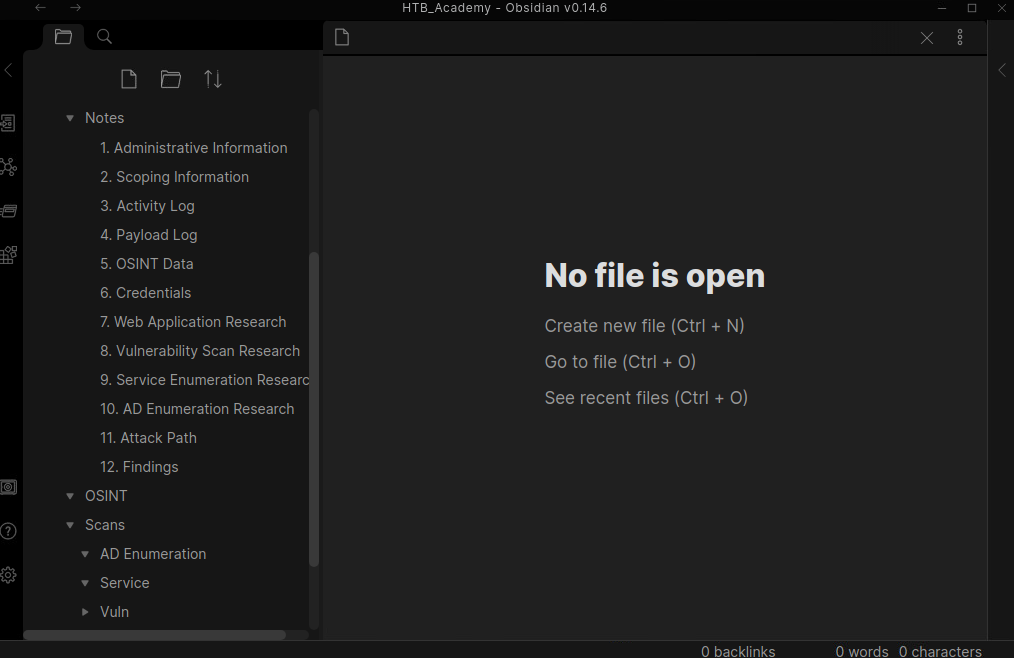
Taking a quick look at the directory structure, we can see each folder we created previously and some now populated with Obsidian Markdown pages.
Notetaking & Organization
sasorirose@htb[/htb]$ tree.
└── Inlanefreight Penetration Test
    ├── Admin
    ├── Deliverables
    ├── Evidence
    │   ├── Findings
    │   │   ├── H1 - Kerberoasting.md
    │   │   ├── H2 - ASREPRoasting.md
    │   │   ├── H3 - LLMNR&NBT-NS Response Spoofing.md
    │   │   └── H4 - Tomcat Manager Weak Credentials.md
    │   ├── Logging output
    │   ├── Misc files
    │   ├── Notes
    │   │   ├── 10. AD Enumeration Research.md
    │   │   ├── 11. Attack Path.md
    │   │   ├── 12. Findings.md
    │   │   ├── 1. Administrative Information.md
    │   │   ├── 2. Scoping Information.md
    │   │   ├── 3. Activity Log.md
    │   │   ├── 4. Payload Log.md
    │   │   ├── 5. OSINT Data.md
    │   │   ├── 6. Credentials.md
    │   │   ├── 7. Web Application Research.md
    │   │   ├── 8. Vulnerability Scan Research.md
    │   │   └── 9. Service Enumeration Research.md
    │   ├── OSINT
    │   ├── Scans
    │   │   ├── AD Enumeration
    │   │   ├── Service
    │   │   ├── Vuln
    │   │   └── Web
    │   └── Wireless
    └── Retest

16 directories, 16 files
Reminder: The folder and notetaking structure shown above is what has worked for us in our careers but will differ from person to person and engagement to engagement. We encourage you to try this out as a base, see how it works for you, and use it as a basis for coming up with a style that works for you. What's important is that we are thorough and organized, and there is no singular way to approach this. Obsidian is a great tool, and this format is clean, easy to follow, and easily reproducible from engagement to engagement. You could create a script to create the directory structure and the initial 10 Markdown files. You will get a chance to play around with this sample structure via GUI access to a Parrot VM at the end of this section.