Network Traffic Analysis
Network Traffic Analysis (NTA) can be described as the act of examining network traffic to characterize common ports and protocols utilized, establish a baseline for our environment, monitor and respond to threats, and ensure the greatest possible insight into our organization's network.
This process helps security specialists determine anomalies, including security threats in the network, early and effectively pinpoint threats. Network Traffic Analysis can also facilitate the process of meeting security guidelines. Attackers update their tactics frequently to avoid detection and leverage legitimate credentials with tools that most companies allow in their networks, making detection and, subsequently, response challenging for defenders. In such cases, Network Traffic Analysis can again prove helpful. Everyday use cases of NTA include:
Collectingreal-time traffic within the network to analyze upcoming threats.
Settinga baseline for day-to-day network communications.
Identifyingand analyzing traffic from non-standard ports, suspicious hosts, and issues with networking protocols such as HTTP errors, problems with TCP, or other networking misconfigurations.
Detectingmalware on the wire, such as ransomware, exploits, and non-standard interactions.
NTA is also useful when investigating past incidents and during threat hunting.
Try to picture a threat actor targeting and infiltrating our network. If they wish to breach the network, attackers must inevitably interact and communicate with our infrastructure. Network communication takes place over many different ports and protocols, all being utilized concurrently by employees, equipment, and customers. To spot malicious traffic, we would need to use our knowledge of typical network traffic within our enclave. Doing so will narrow down our search and help us quickly find and disrupt adversarial communication.
For example, if we detect many SYN packets on ports that we never (or rarely) utilize in our network, we can conclude that this is most likely someone trying to determine what ports are open on our hosts. Actions like this are typical markers of a portscan. Performing such an analysis and coming to such conclusions requires specific skills and knowledge.
Required Skills and Knowledge
The skills we are about to list and describe require theoretical and practical knowledge acquired over time. We do not have to know everything by heart, but we should know what to look for when certain aspects of the content seem unfamiliar. This applies not only to NTA but also to most other topics we will deal with in cybersecurity.
TCP/IP Stack & OSI Model
This understanding will ensure we grasp how networking traffic and the host applications interact.
Basic Network Concepts
Understanding what types of traffic we will see at each level includes an understanding of the individual layers that make up the TCP/IP and OSI model and the concepts of switching and routing. If we tap a network on a backbone link, we will see much more traffic than usual, and it will be vastly different from what we find tapping an office switch.
Common Ports and Protocols
Identifying standard ports and protocols quickly and having a functional understanding of how they communicate will ensure we can identify potentially malicious or malformed network traffic.
Concepts of IP Packets and the Sublayers
Foundational knowledge of how TCP and UDP communicate will, at a minimum, ensure we understand what we see or are searching for. TCP, for example, is stream-oriented and allows us to follow a conversation between hosts easily. UDP is quick but not concerned with completeness, so it would be harder to recreate something from this packet type.
Protocol Transport Encapsulation
Each layer will encapsulate the previous. Being able to read or dissect when this encapsulation changes will help us move through data quicker. It is easy to see hints based on encapsulation headers.
Environment and Equipment
The list below contains many different tools and equipment types that can be utilized to perform network traffic analysis. Each will provide a different way to capture or dissect the traffic. Some offer ways to copy and capture, while others read and ingest. This module will explore just a few of these (Wireshark and tcpdump mostly). Keep in mind these tools are not strictly geared for admins. Many of these can be used for malicious reasons as well.
Common Traffic Analysis Tools
BPF Syntax
Many of the tools mentioned above have their syntax and commands to utilize, but one that is shared among them is Berkeley Packet Filter (BPF) syntax. This syntax is the primary method we will use. In essence, BPF is a technology that enables a raw interface to read and write from the Data-Link layer. With all this in mind, we care for BPF because of the filtering and decoding abilities it provides us. We will be utilizing BPF syntax through the module, so a basic understanding of how a BPF filter is set up can be helpful. For more information on BPF syntax, check out this reference.
Performing Network Traffic Analysis
Performing analysis can be as simple as watching live traffic roll by in our console or as complex as capturing data with a tap, sending it back to a SIEM for ingestion, and analyzing the pcap data for signatures and alerts related to common tactics and techniques.
At a minimum, to listen passively, we need to be connected to the network segment we wish to listen on. This is especially true in a switched environment where VLANS and switch ports will not forward traffic outside their broadcast domain. With that in mind, if we wish to capture traffic from a specific VLAN, our capture device should be connected to that same network. Devices like network taps, switch or router configurations like span ports, and port mirroring can allow us to get a copy of all traffic traversing a specific link, regardless of what network segment or destination it belongs to.
NTA Workflow
Traffic analysis is not an exact science. NTA can be a very dynamic process and is not a direct loop. It is greatly influenced by what we are looking for (network errors vs. malicious actions) and where we have visibility into our network. Performing traffic analysis can distill down to a few basic tenants.
NTA Workflow
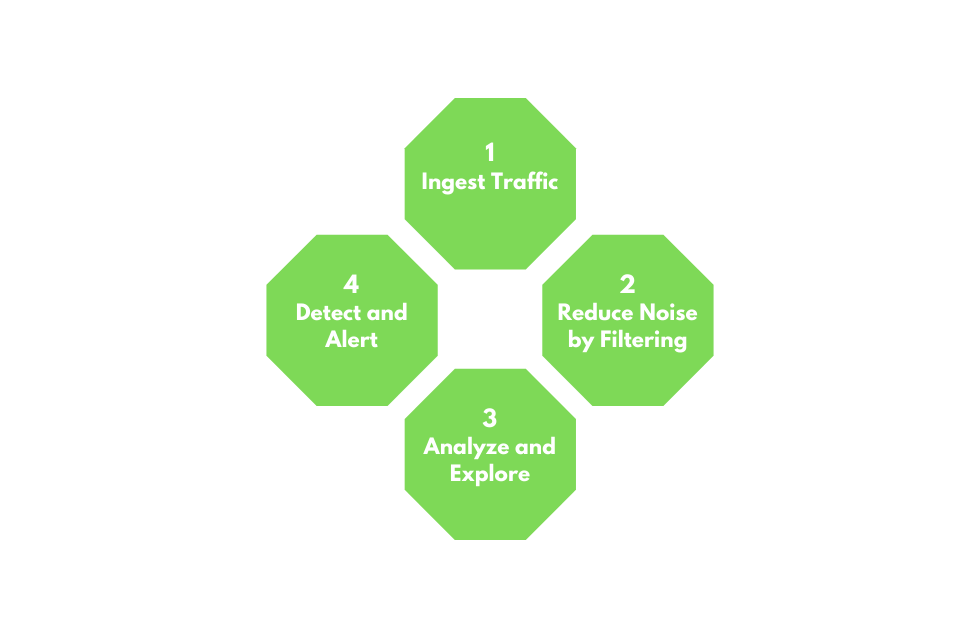
1. Ingest Traffic
Once we have decided on our placement, begin capturing traffic. Utilize capture filters if we already have an idea of what we are looking for.
2. Reduce Noise by Filtering
Capturing traffic of a link, especially one in a production environment, can be extremely noisy. Once we complete the initial capture, an attempt to filter out unnecessary traffic from our view can make analysis easier. (Broadcast and Multicast traffic, for example.)
3. Analyze and Explore
Now is the time to start carving out data pertinent to the issue we are chasing down. Look at specific hosts, protocols, even things as specific as flags set in the TCP header. The following questions will help us:
- Is the traffic encrypted or plain text? Should it be?
- Can we see users attempting to access resources to which they should not have access?
- Are different hosts talking to each other that typically do not?
4. Detect and Alert
- Are we seeing any errors? Is a device not responding that should be?
- Use our analysis to decide if what we see is benign or potentially malicious.
- Other tools like IDS and IPS can come in handy at this point. They can run heuristics and signatures against the traffic to determine if anything within is potentially malicious.
5. Fix and Monitor
Fix and monitor is not a part of the loop but should be included in any workflow we perform. If we make a change or fix an issue, we should continue to monitor the source for a time to determine if the issue has been resolved.
Networking Primer - Layers 1-4
This section serves as a quick refresher on networking and how some standard protocols we can see while performing traffic captures work. These concepts are at the core of capturing and dissecting traffic. Without a fundamental understanding of typical network flow and what ports and protocols are used, we cannot accurately analyze any traffic we capture. If this is the first time you encounter some of these terms or concepts, we suggest completing the Introduction to Networking Module first.
OSI / TCP-IP Models
Networking Models
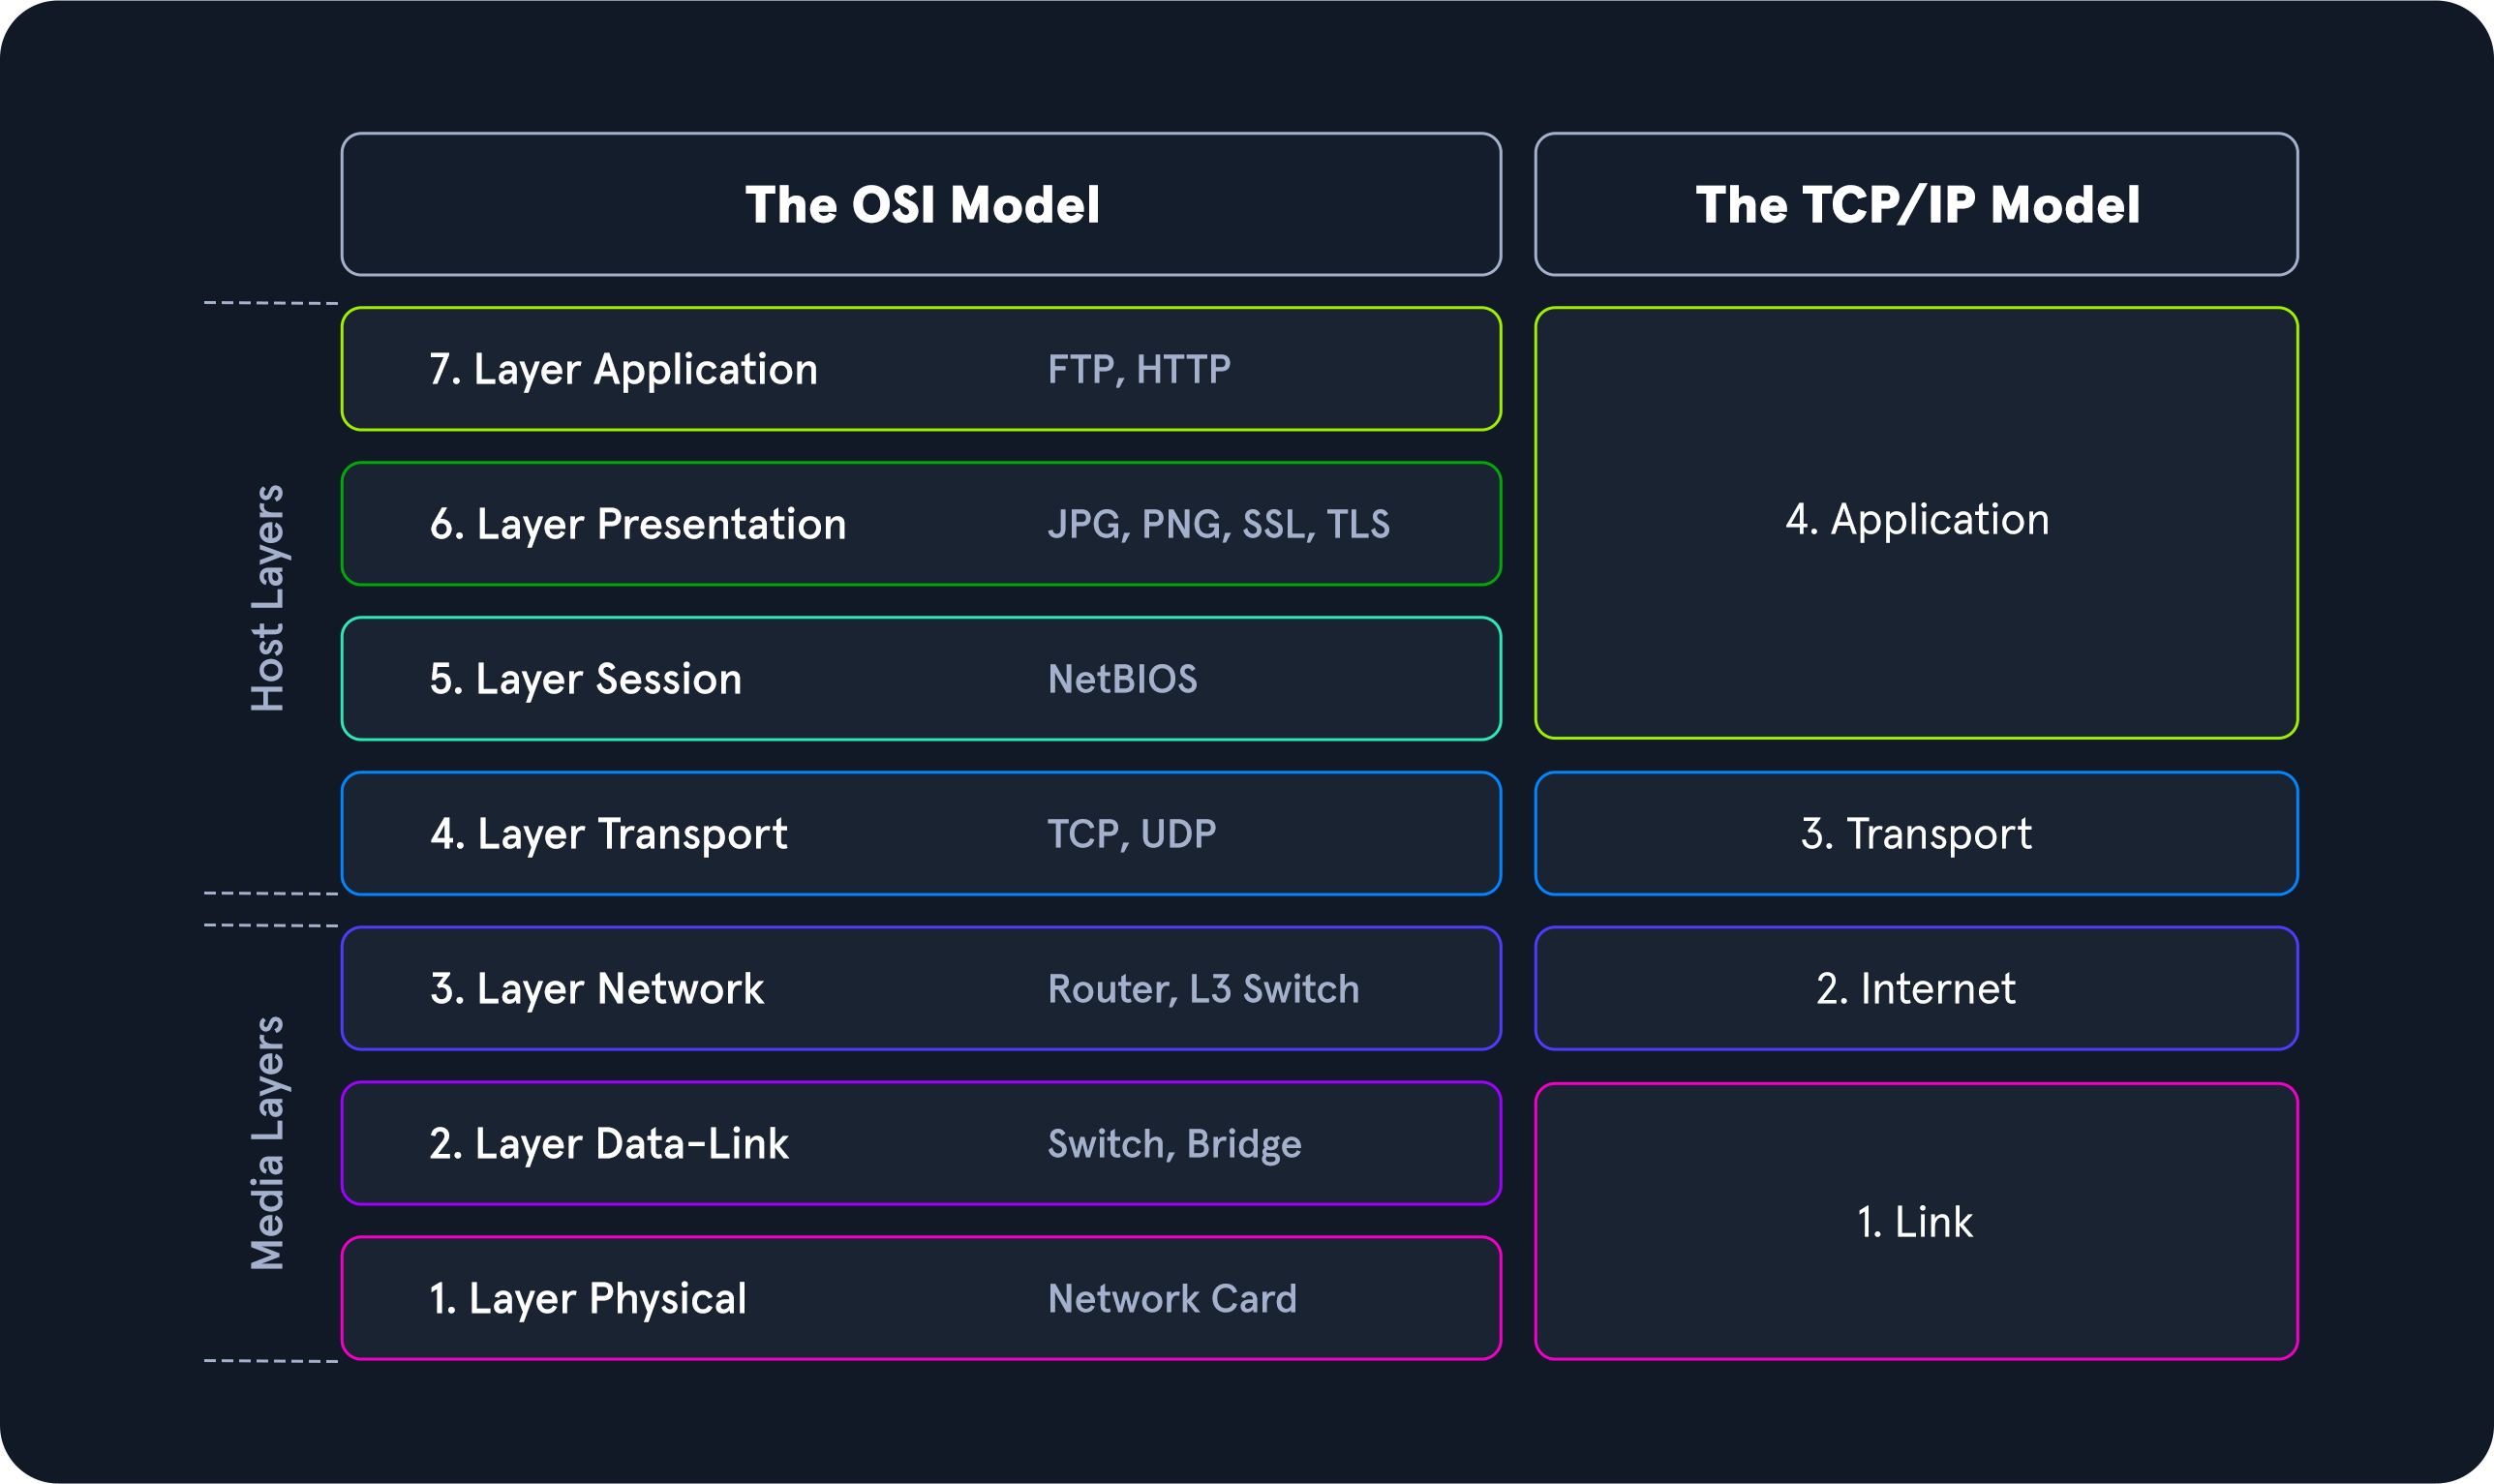
The image above gives a great view of the Open Systems Interconnect (OSI) model and the Transmission Control Protocol - Internet Protocol (TCP-IP) model side by side. The models are a graphical representation of how communication is handled between networked computers. Let's take a second to compare the two:
Model Traits Comparison.
When examining these two models, we can notice that the OSI model is segmented more than the TCP-IP model. This is because it is broken down into small functional chunks. Layers one through four of the OSI model are focused on controlling the transportation of data between hosts. This control includes everything from the physical medium used for transmission to the protocol utilized to manage the conversation or lack thereof when transporting data. Layers five through seven handle the interpretation, management, and presentation of the encapsulated data presented to the end-user. Think of the OSI model as the theory behind how everything works, whereas the TCP-IP model is more closely aligned with the actual functionality of networking. The TCP-IP model is a bit more blended, and the rules are flexible. The TCP-IP model comprises four layers where layers five, six, and seven of the OSI model align with layer four of the TCP-IP model. Layer three deals with transportation, layer two is the internet layer which aligns with the network layer in OSI, and layer one is the link-layer which covers layers two and one of the OSI model.
Throughout this module, we will examine many different Protocol Data Units (PDU), so a functional understanding of how it appears in theory and on the wire is required. A PDU is a data packet made up of control information and data encapsulated from each layer of the OSI model. The breakout below will show how the layers in the two models match up to a PDU.
PDU Example
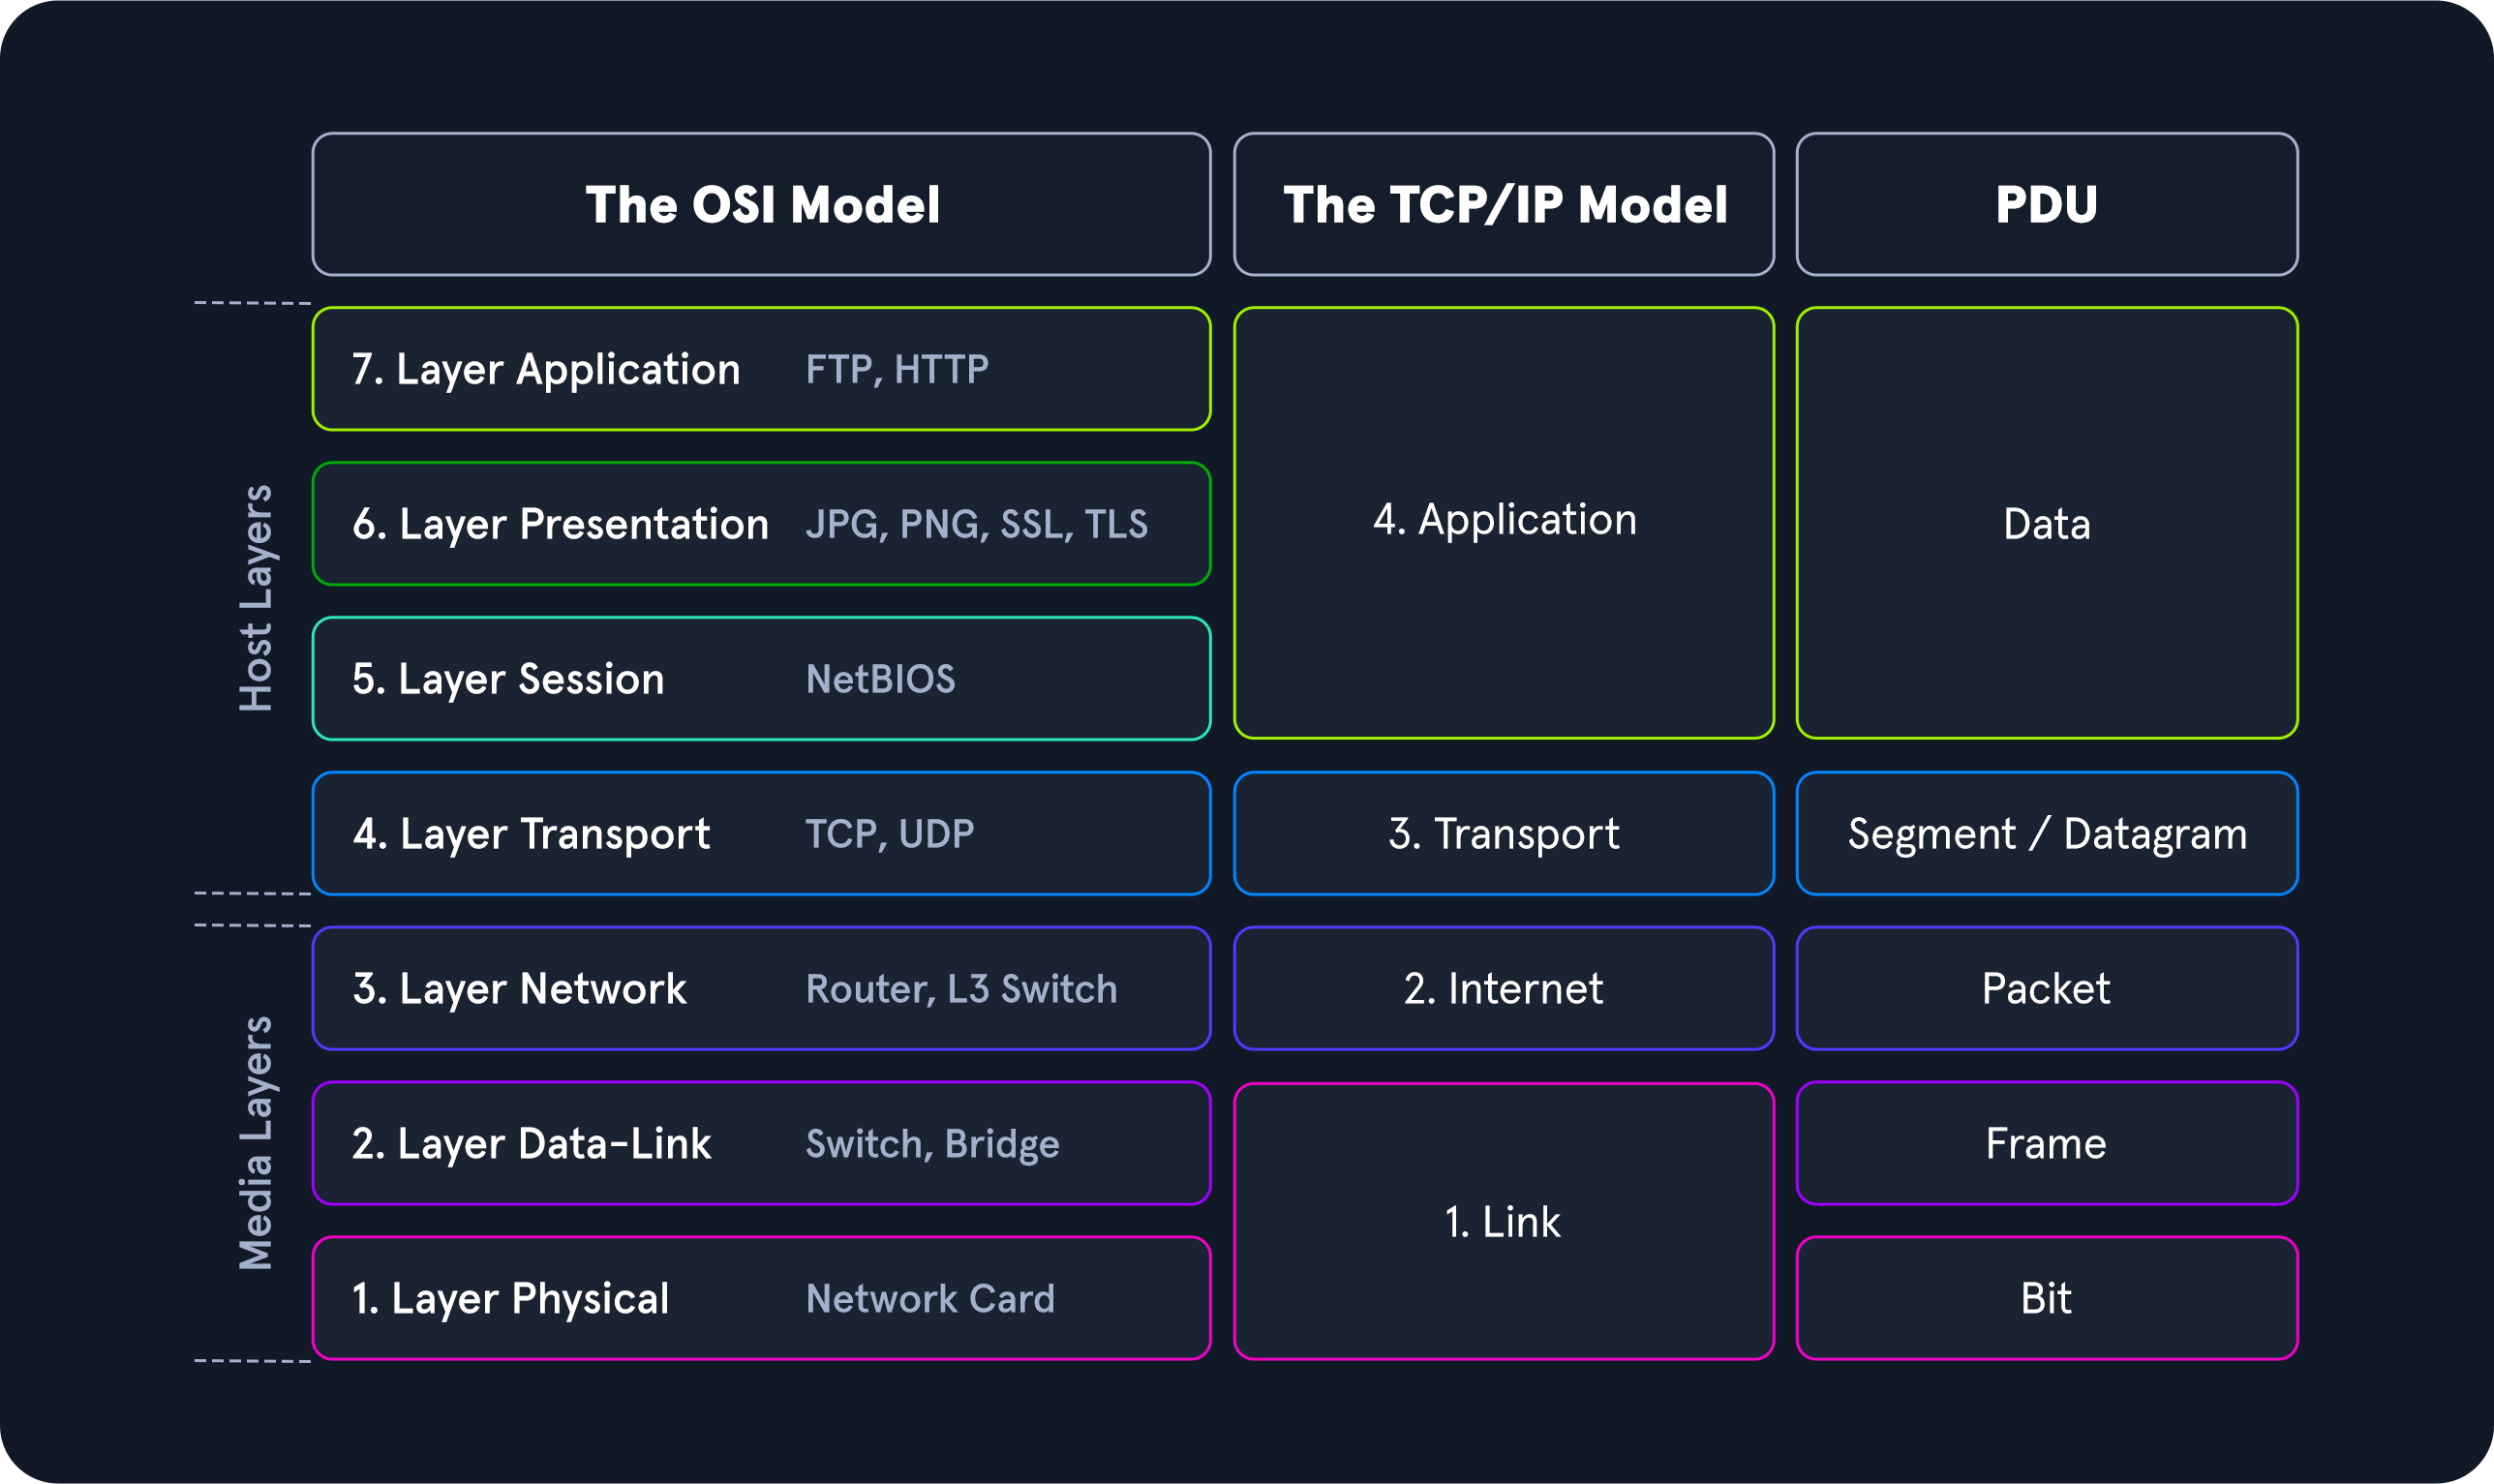
When inspecting a PDU, we need to keep the idea of encapsulation in mind. As our data moves down the protocol stack, each layer will wrap the previous layers' data in a new bubble we call encapsulation. This bubble adds the necessary information of that layer into the header of the PDU. This information can vary by level, but it includes what is held by the previous layer, operational flags, any options required to negotiate communications, the source and destination IP addresses, ports, transport, and application layer protocols.
PDU Packet Breakdown
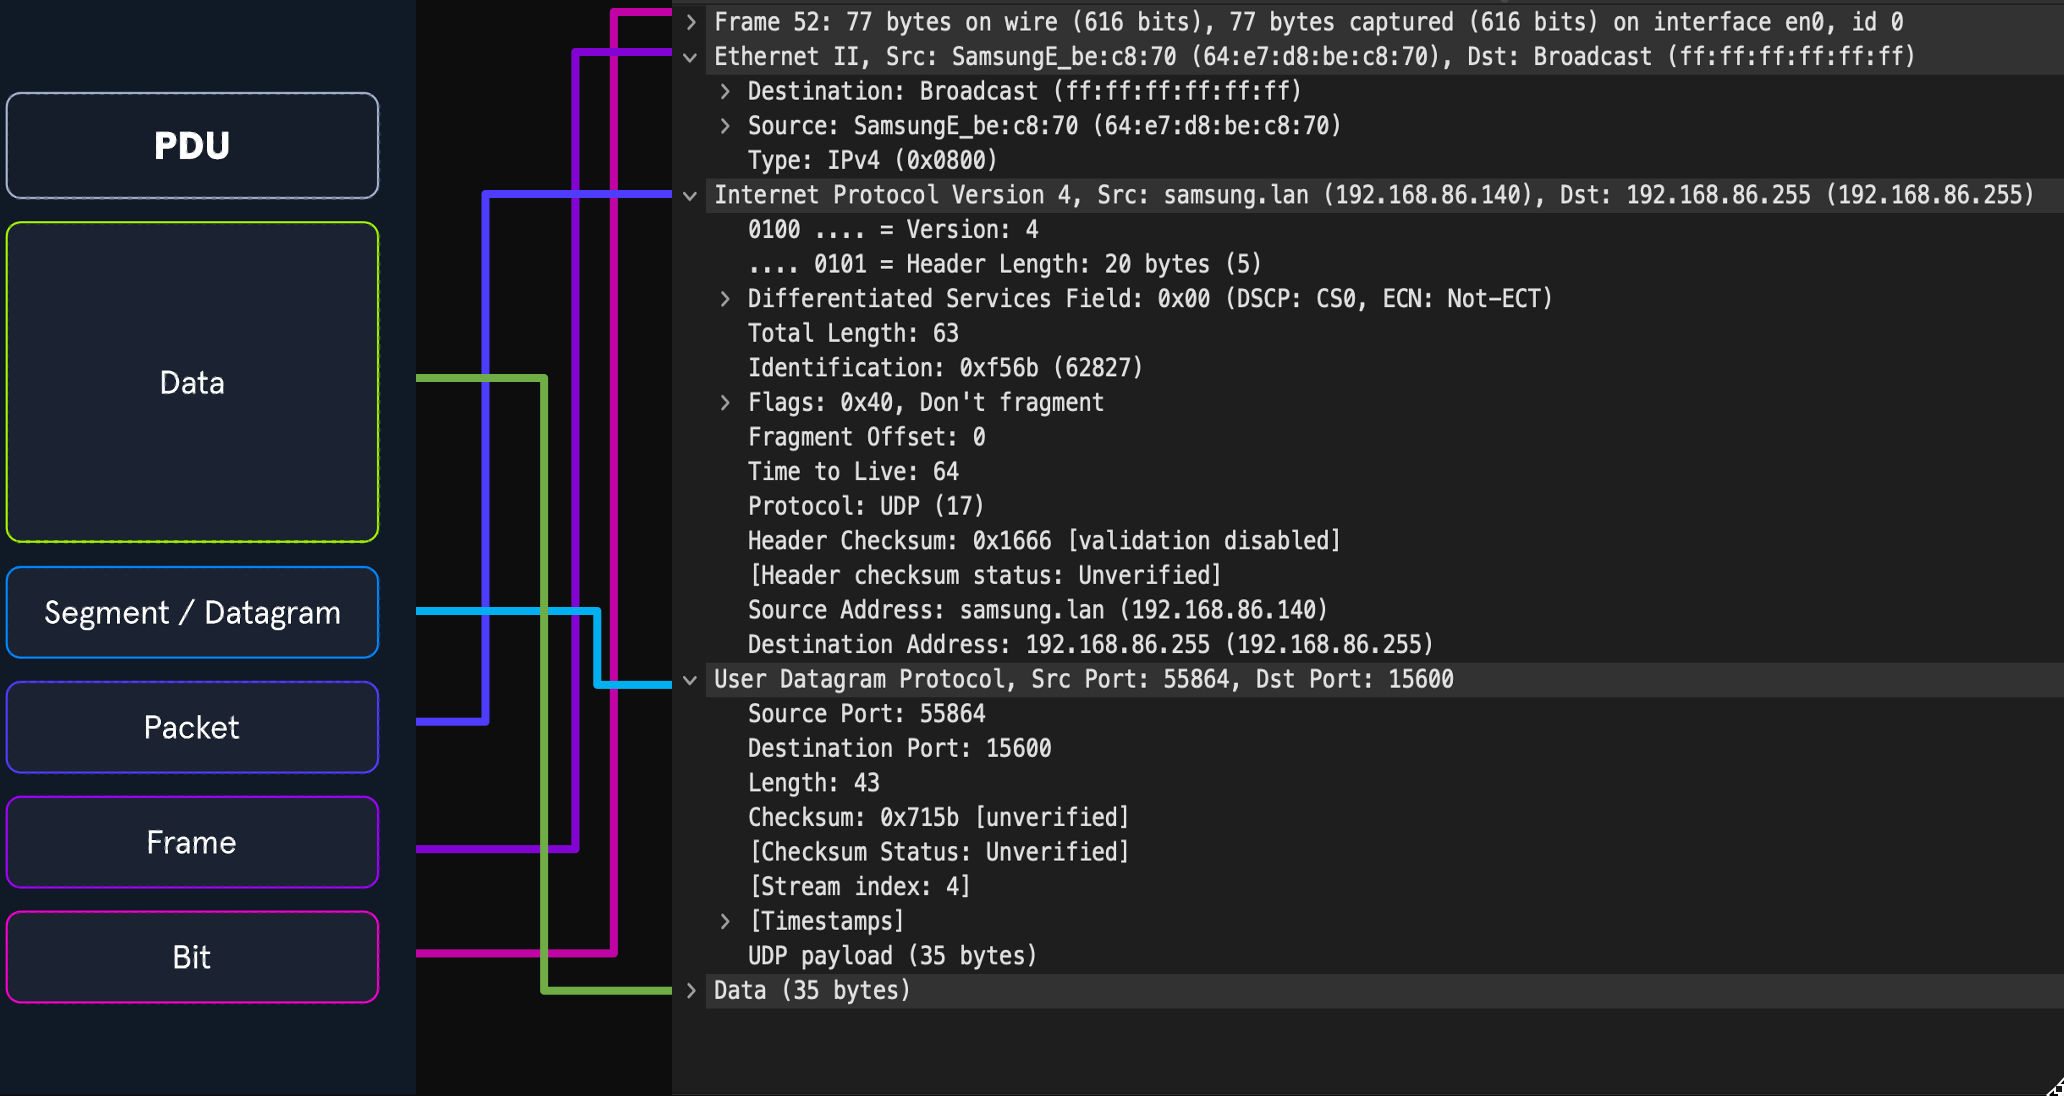
The image above shows us the makeup of a PDU side by side with a packet breakout from Wireshark's Packet Details pane. Please take note that when we see the breakout in Wireshark, it is in reverse order. Wireshark shows us the PDU in reverse because it is in the order that it was unencapsulated.
Addressing Mechanisms
Now that we have gone over the basic concepts driving networking behavior let us take some time to discuss the addressing mechanisms that enable the delivery of our packets to the correct hosts. We will begin with Media Access Control addresses first.
MAC-Addressing
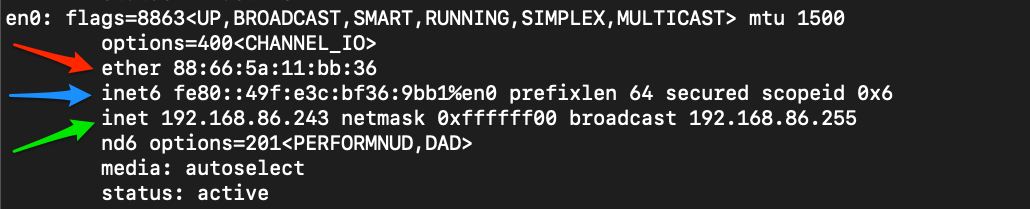
Each logical or physical interface attached to a host has a Media Access Control (MAC) address. This address is a 48-bit six octet address represented in hexadecimal format. If we look at the image below, we can see an example of one by the red arrow.
Mac-Address
MAC-addressing is utilized in Layer two ( the data-link or link-layer depending on which model you look at ) communications between hosts. This works through host-to-host communication within a broadcast domain. If layer two traffic needs to cross a layer three interface, that PDU is sent to the layer three egress interface, and it is routed to the correct network. At layer two, this looks as though the PDU is addressed to the router interface, and the router will take the layer three address into account when determining where to send it next. Once it makes a choice, it strips the encapsulation at layer two and replaces it with new information that indicates the next physical address in the route.
IP Addressing
The Internet Protocol (IP) was developed to deliver data from one host to another across network boundaries. IP is responsible for routing packets, the encapsulation of data, and fragmentation and reassembly of datagrams when they reach the destination host. By nature, IP is a connectionless protocol that provides no assurances that data will reach its intended recipient. For the reliability and validation of data delivery, IP relies on upper-layer protocols such as TCP. Currently, there exist two main versions of IP. IPv4, which is the current dominant standard, and IPv6, which is intended to be the successor of IPv4.
IPv4
The most common addressing mechanism most are familiar with is the Internet Protocol address version 4 (IPv4). IPv4 addressing is the core method of routing packets across networks to hosts located outside our immediate vicinity. The image below shows us an example of an IPv4 address by the green arrow.
IP Address

An IPv4 address is made up of a 32-bit four octet number represented in decimal format. In our example, we can see the address 192.168.86.243. Each octet of an IP address can be represented by a number ranging from 0 to 255. When examining a PDU, we will find IP addresses in layer three (Network) of the OSI model and layer two (internet) of the TCP-IP model. We will not deep dive into IPv4 here, but for the sake of this module, understand what these addresses are, what they do for us, and at which layer they are used.