Tcpdump Fundamentals
Tcpdump is a command-line packet sniffer that can directly capture and interpret data frames from a file or network interface. It was built for use on any Unix-like operating system and had a Windows twin called WinDump. It is a potent and straightforward tool used on most Unix-based systems. It does not require a GUI and can be used through any terminal or remote connection, such as SSH. Nevertheless, this tool can seem overwhelming at first due to the many different functions and filters it offers us. However, once we learn the essential functions, we will find it much easier to use this tool efficiently. To capture network traffic from "off the wire," it uses the libraries pcap and libpcap, paired with an interface in promiscuous mode to listen for data. This allows the program to see and capture packets sourcing from or destined for any device in the local area network, not just the packets destined for us.
TCPDump is available for most Unix systems and Unix derivatives, such as AIX, BSD, Linux, Solaris, and is supplied by many manufacturers already in the system. Due to the direct access to the hardware, we need the root or the administrator's privileges to run this tool. For us that means we will have to utilize sudo to execute TCPDump as seen in the examples below. TCPDump often comes preinstalled on the majority of Linux operating systems.
It should be noted that Windows had a port of TCPDump called Windump. Support for windump has ceased. As an alternative running a Linux distribution such as Parrot or Ubuntu in Windows Subsystem for Linux can be an easy way to have a Linux virtual host right on our computer, allowing for the use of TCPDump and many other Linux built tools.
Locate Tcpdump
To validate if the package exists on our host, use the following command:
Tcpdump Fundamentals
sasorirose@htb[/htb]$ which tcpdumpOften it can be found in /usr/sbin/tcpdump. However, if the package does not exist, we can install it with:
Install Tcpdump
Tcpdump Fundamentals
sasorirose@htb[/htb]$ sudo apt install tcpdumpWe can run the tcpdump package with the --version switch to check our install and current package version to validate our install.
Tcpdump Version Validation
Tcpdump Fundamentals
sasorirose@htb[/htb]$ sudo tcpdump --versiontcpdump version 4.9.3
libpcap version 1.9.1 (with TPACKET_V3)
OpenSSL 1.1.1f  31 Mar 2020
Traffic Captures with Tcpdump
Because of the many different functions and filters, we should first familiarize ourselves with the tool's essential features. Let us discuss some basic TCPDump options, demo some commands, and show how to save traffic to PCAP files and read from these.
Basic Capture Options
Below is a table of basic Tcpdump switches we can use to modify how our captures run. These switches can be chained together to craft how the tool output is shown to us in STDOUT and what is saved to the capture file. This is not an exhaustive list, and there are many more we can use, but these are the most common and valuable.
Man Page Utilization
To see the complete list of switches, we can utilize the man pages:
Tcpdump Man Page
Tcpdump Fundamentals
sasorirose@htb[/htb]$ man tcpdumpHere are some examples of basic Tcpdump switch usage along with descriptions of what is happening:
Listing Available Interfaces
Tcpdump Fundamentals
sasorirose@htb[/htb]$ sudo tcpdump -D1.eth0 [Up, Running, Connected]
2.any (Pseudo-device that captures on all interfaces) [Up, Running]
3.lo [Up, Running, Loopback]
4.bluetooth0 (Bluetooth adapter number 0) [Wireless, Association status unknown]
5.bluetooth-monitor (Bluetooth Linux Monitor) [Wireless]
6.nflog (Linux netfilter log (NFLOG) interface) [none]
7.nfqueue (Linux netfilter queue (NFQUEUE) interface) [none]
8.dbus-system (D-Bus system bus) [none]
9.dbus-session (D-Bus session bus) [none]
The above command calls tcpdump using sudo privileges and lists the usable network interfaces. We can choose one of these network interfaces and tell tcpdump which interfaces it should listen to.
Choosing an Interface to Capture From
Tcpdump Fundamentals
sasorirose@htb[/htb]$ sudo tcpdump -i eth0tcpdump: verbose output suppressed, use -v[v]... for full protocol decode
listening on eth0, link-type EN10MB (Ethernet), snapshot length 262144 bytes
10:58:33.719241 IP 172.16.146.2.55260 > 172.67.1.1.https: Flags [P.], seq 1953742992:1953743073, ack 2034210498, win 501, length 81
10:58:33.747853 IP 172.67.1.1.https > 172.16.146.2.55260: Flags [.], ack 81, win 158, length 0
10:58:33.750393 IP 172.16.146.2.52195 > 172.16.146.1.domain: 7579+ PTR? 1.1.67.172.in-addr.arpa. (41)
In this terminal, we are calling tcpdump and selecting the interface eth0 to capture traffic. Once we issue the command, tcpdump will begin to sniff traffic and see the first few packets across the interface. By issuing the -nn switches as seen below, we tell TCPDump to refrain from resolving IP addresses and port numbers to their hostnames and common port names. In this representation, the last octet is the port from/to which the connection goes.
Disable Name Resolution
Tcpdump Fundamentals
sasorirose@htb[/htb]$ sudo tcpdump -i eth0 -nntcpdump: verbose output suppressed, use -v[v]... for full protocol decode
listening on eth0, link-type EN10MB (Ethernet), snapshot length 262144 bytes
11:02:35.580449 IP 172.16.146.2.48402 > 52.31.199.148.443: Flags [P.], seq 988167196:988167233, ack 1512376150, win 501, options [nop,nop,TS val 214282239 ecr 77421665], length 37
11:02:35.588695 IP 172.16.146.2.55272 > 172.67.1.1.443: Flags [P.], seq 940648841:940648916, ack 4248406693, win 501, length 75
11:02:35.654368 IP 172.67.1.1.443 > 172.16.146.2.55272: Flags [.], ack 75, win 70, length 0
11:02:35.728889 IP 52.31.199.148.443 > 172.16.146.2.48402: Flags [P.], seq 1:34, ack 37, win 118, options [nop,nop,TS val 77434740 ecr 214282239], length 33
11:02:35.728988 IP 172.16.146.2.48402 > 52.31.199.148.443: Flags [.], ack 34, win 501, options [nop,nop,TS val 214282388 ecr 77434740], length 0
11:02:35.729073 IP 52.31.199.148.443 > 172.16.146.2.48402: Flags [P.], seq 34:65, ack 37, win 118, options [nop,nop,TS val 77434740 ecr 214282239], length 31
11:02:35.729081 IP 172.16.146.2.48402 > 52.31.199.148.443: Flags [.], ack 65, win 501, options [nop,nop,TS val 214282388 ecr 77434740], length 0
11:02:35.729348 IP 52.31.199.148.443 > 172.16.146.2.48402: Flags [F.], seq 65, ack 37, win 118, options [nop,nop,TS val 77434740 ecr 214282239], length 0
When utilizing the -e switch, we are tasking tcpdump to include the ethernet headers in the capture's output along with its regular content. We can see this worked by examining the output. Usually, the first and second fields consist of the Timestamp and then the IP header's beginning. Now it consists of Timestamp and the source MAC Address of the host.
Display the Ethernet Header
Tcpdump Fundamentals
sasorirose@htb[/htb]$ sudo tcpdump -i eth0 -etcpdump: verbose output suppressed, use -v[v]... for full protocol decode
listening on eth0, link-type EN10MB (Ethernet), snapshot length 262144 bytes
11:05:45.982115 00:0c:29:97:52:65 (oui Unknown) > 8a:66:5a:11:8d:64 (oui Unknown), ethertype IPv4 (0x0800), length 103: 172.16.146.2.57142 > ec2-99-80-22-207.eu-west-1.compute.amazonaws.com.https: Flags [P.], seq 922951468:922951505, ack 1842875143, win 501, options [nop,nop,TS val 1368272062 ecr 65637925], length 37
11:05:45.989652 00:0c:29:97:52:65 (oui Unknown) > 8a:66:5a:11:8d:64 (oui Unknown), ethertype IPv4 (0x0800), length 129: 172.16.146.2.55272 > 172.67.1.1.https: Flags [P.], seq 940656124:940656199, ack 4248413119, win 501, length 75
11:05:46.047731 00:0c:29:97:52:65 (oui Unknown) > 8a:66:5a:11:8d:64 (oui Unknown), ethertype IPv4 (0x0800), length 85: 172.16.146.2.54006 > 172.16.146.1.domain: 31772+ PTR? 207.22.80.99.in-addr.arpa. (43)
11:05:46.049134 8a:66:5a:11:8d:64 (oui Unknown) > 00:0c:29:97:52:65 (oui Unknown), ethertype IPv4 (0x0800), length 147: 172.16.146.1.domain > 172.16.146.2.54006: 31772 1/0/0 PTR ec2-99-80-22-207.eu-west-1.compute.amazonaws.com. (105)
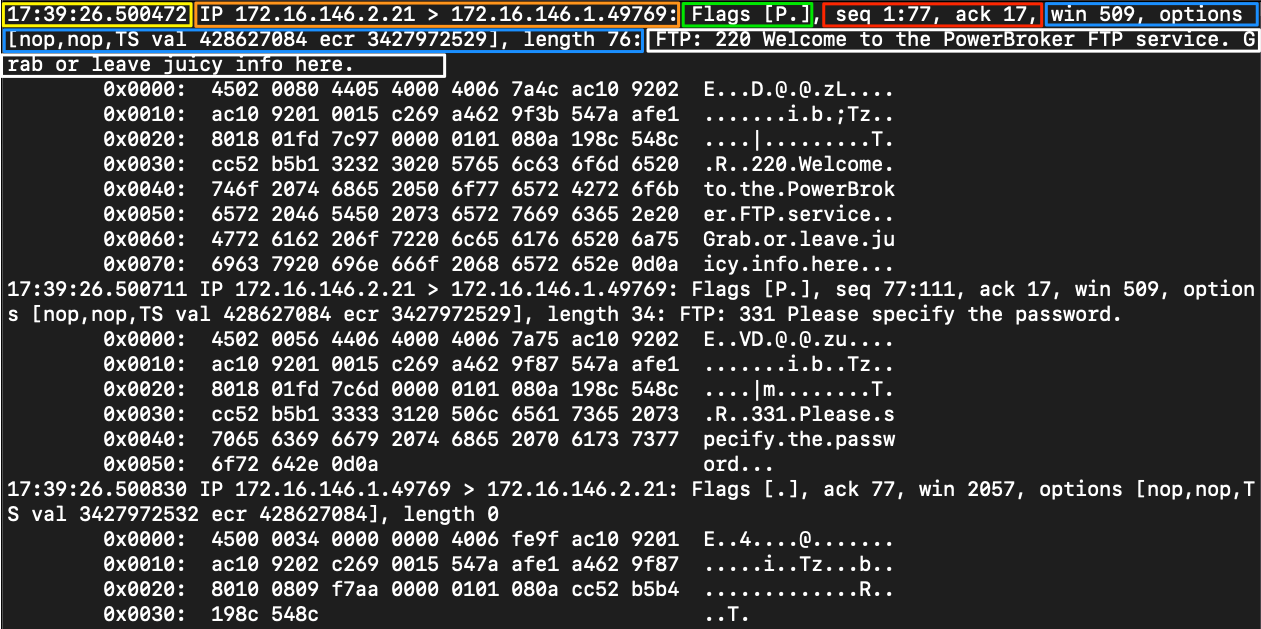
By issuing the -X switch, we can see the packet a bit clearer now. We get an ASCII output on the right to interpret anything in clear text that corresponds to the hexadecimal output on the left.
Include ASCII and Hex Output
Tcpdump Fundamentals
sasorirose@htb[/htb]$ sudo tcpdump -i eth0 -Xtcpdump: verbose output suppressed, use -v[v]... for full protocol decode
listening on eth0, link-type EN10MB (Ethernet), snapshot length 262144 bytes
11:10:34.972248 IP 172.16.146.2.57170 > ec2-99-80-22-207.eu-west-1.compute.amazonaws.com.https: Flags [P.], seq 2612172989:2612173026, ack 3165195759, win 501, options [nop,nop,TS val 1368561052 ecr 65712142], length 37
    0x0000:  4500 0059 4352 4000 4006 3f1b ac10 9202  E..YCR@.@.?.....
    0x0010:  6350 16cf df52 01bb 9bb2 98bd bca9 0def  cP...R..........
    0x0020:  8018 01f5 b87d 0000 0101 080a 5192 959c  .....}......Q...
    0x0030:  03ea b00e 1703 0300 2000 0000 0000 0000  ................
    0x0040:  0adb 84ac 34b4 910a 0fb4 2f49 9865 eb45  ....4...../I.e.E
    0x0050:  883c eafd 8266 3e23 88                   .<...f>#.11:10:34.984582 IP 172.16.146.2.38732 > 172.16.146.1.domain: 22938+ A? app.hackthebox.eu. (35)
    0x0000:  4500 003f 2e6b 4000 4011 901e ac10 9202  E..?.k@.@.......
    0x0010:  ac10 9201 974c 0035 002b 7c61 599a 0100  .....L.5.+|aY...
    0x0020:  0001 0000 0000 0000 0361 7070 0a68 6163  .........app.hac
    0x0030:  6b74 6865 626f 7802 6575 0000 0100 01    kthebox.eu.....
11:10:35.055497 IP 172.16.146.2.43116 > 172.16.146.1.domain: 6524+ PTR? 207.22.80.99.in-addr.arpa. (43)
    0x0000:  4500 0047 2e72 4000 4011 900f ac10 9202  E..G.r@.@.......
    0x0010:  ac10 9201 a86c 0035 0033 7c69 197c 0100  .....l.5.3|i.|..
    0x0020:  0001 0000 0000 0000 0332 3037 0232 3202  .........207.22.
    0x0030:  3830 0239 3907 696e 2d61 6464 7204 6172  80.99.in-addr.ar
    0x0040:  7061 0000 0c00 01                        pa.....
Pay attention to the level of detail in the output above. We will notice that we have information on the IP header options like time to live, offset, and other flags and more details into the upper layer protocols. Below, we are combining the switches to craft the output to our liking.
Tcpdump Switch Combinations
Tcpdump Fundamentals
sasorirose@htb[/htb]$ sudo tcpdump -i eth0 -nnvXXtcpdump: listening on eth0, link-type EN10MB (Ethernet), snapshot length 262144 bytes
11:13:59.149599 IP (tos 0x0, ttl 64, id 24075, offset 0, flags [DF], proto TCP (6), length 89)
    172.16.146.2.42454 > 54.77.251.34.443: Flags [P.], cksum 0x6fce (incorrect -> 0xb042), seq 671020720:671020757, ack 3699222968, win 501, options [nop,nop,TS val 1154433101 ecr 1116647414], length 37
    0x0000:  8a66 5a11 8d64 000c 2997 5265 0800 4500  .fZ..d..).Re..E.
    0x0010:  0059 5e0b 4000 4006 6d11 ac10 9202 364d  .Y^.@.@.m.....6M
    0x0020:  fb22 a5d6 01bb 27fe f6b0 dc7d a9b8 8018  ."....'....}....
    0x0030:  01f5 6fce 0000 0101 080a 44cf 404d 428e  ..o.......D.@MB.
    0x0040:  aff6 1703 0300 2000 0000 0000 0000 09bb  ................
    0x0050:  38d9 d89a 2d70 73d5 a01e 9df7 2c48 5b8a  8...-ps.....,H[.
    0x0060:  d64d 8e42 2ccc 43                        .M.B,.C
11:13:59.157113 IP (tos 0x0, ttl 64, id 31823, offset 0, flags [DF], proto UDP (17), length 63)
    172.16.146.2.55351 > 172.16.146.1.53: 26460+ A? app.hackthebox.eu. (35)
    0x0000:  8a66 5a11 8d64 000c 2997 5265 0800 4500  .fZ..d..).Re..E.
    0x0010:  003f 7c4f 4000 4011 423a ac10 9202 ac10  .?|O@.@.B:......
    0x0020:  9201 d837 0035 002b 7c61 675c 0100 0001  ...7.5.+|ag\....
    0x0030:  0000 0000 0000 0361 7070 0a68 6163 6b74  .......app.hackt
    0x0040:  6865 626f 7802 6575 0000 0100 01         hebox.eu.....
11:13:59.158029 IP (tos 0x0, ttl 64, id 20784, offset 0, flags [none], proto UDP (17), length 111)
    172.16.146.1.53 > 172.16.146.2.55351: 26460 3/0/0 app.hackthebox.eu. A 104.20.55.68, app.hackthebox.eu. A 172.67.1.1, app.hackthebox.eu. A 104.20.66.68 (83)
    0x0000:  000c 2997 5265 8a66 5a11 8d64 0800 4500  ..).Re.fZ..d..E.
    0x0010:  006f 5130 0000 4011 ad29 ac10 9201 ac10  .oQ0..@..)......
    0x0020:  9202 0035 d837 005b 9d2e 675c 8180 0001  ...5.7.[..g\....
    0x0030:  0003 0000 0000 0361 7070 0a68 6163 6b74  .......app.hackt
    0x0040:  6865 626f 7802 6575 0000 0100 01c0 0c00  hebox.eu........
    0x0050:  0100 0100 0000 ab00 0468 1437 44c0 0c00  .........h.7D...
    0x0060:  0100 0100 0000 ab00 04ac 4301 01c0 0c00  ..........C.....
    0x0070:  0100 0100 0000 ab00 0468 1442 44         .........h.BD
11:13:59.158335 IP (tos 0x0, ttl 64, id 20242, offset 0, flags [DF], proto TCP (6), length 60)
    172.16.146.2.55416 > 172.67.1.1.443: Flags [S], cksum 0xeb85 (incorrect -> 0x72f7), seq 3766489491, win 64240, options [mss 1460,sackOK,TS val 508232750 ecr 0,nop,wscale 7], length 0
    0x0000:  8a66 5a11 8d64 000c 2997 5265 0800 4500  .fZ..d..).Re..E.
    0x0010:  003c 4f12 4000 4006 0053 ac10 9202 ac43  .
When utilizing the switches, chaining them together as in the example above is best practice.
Tcpdump Output
When looking at the output from TCPDump, it can be a bit overwhelming. Running through these basic switches has already shown us several different views. We are going to take a minute to dissect that output and explain what we are seeing. The image and table below will define each field. Keep in mind that the more verbose we are with our filters, the more detail from each header is shown.
Tcpdump Shell Breakdown
There are many other options and information that can be shown. This information varies based on the amount of verbosity that is enabled. For a more detailed understanding of IP and other protocol headers, check out the Networking Primer in section two or the Networking fundamentals path.
There is a great advantage in knowing how a network functions and how to use the filters that TCPDump provides. With them, we can view the network traffic, parse it for any issues, and identify suspicious network interactions quickly. Theoretically, we can use tcpdump to create an IDS/IPS system by having a Bash script analyze the intercepted packets according to a specific pattern. We can then set conditions to, for example, ban a particular IP address that has sent too many ICMP echo requests for a certain period.
File Input/Output with Tcpdump
Using -w will write our capture to a file. Keep in mind that as we capture traffic off the wire, we can quickly use up open disk space and run into storage issues if we are not careful. The larger our network segment, the quicker we will use up storage. Utilizing the switches demonstrated above can help tune the amount of data stored in our PCAPs.
Save our PCAP Output to a File
Tcpdump Fundamentals
sasorirose@htb[/htb]$ sudo tcpdump -i eth0 -w ~/output.pcaptcpdump: listening on eth0, link-type EN10MB (Ethernet), snapshot length 262144 bytes
10 packets captured
131 packets received by filter
0 packets dropped by kernel
This capture above will generate the output to a file called output.pcap. When running tcpdump in this way, the output will not scroll our terminal as usual. All output from tcpdump is being redirected to the file we specified for the capture.
Reading Output From a File
Tcpdump Fundamentals
sasorirose@htb[/htb]$ sudo tcpdump -r ~/output.pcapreading from file /home/trey/output.pcap, link-type EN10MB (Ethernet), snapshot length 262144
11:15:40.321509 IP 172.16.146.2.57236 > ec2-99-80-22-207.eu-west-1.compute.amazonaws.com.https: Flags [P.], seq 2751910362:2751910399, ack 946558143, win 501, options [nop,nop,TS val 1368866401 ecr 65790024], length 37
11:15:40.337302 IP 172.16.146.2.55416 > 172.67.1.1.https: Flags [P.], seq 3766493458:3766493533, ack 4098207917, win 501, length 75
11:15:40.398103 IP 172.67.1.1.https > 172.16.146.2.55416: Flags [.], ack 75, win 73, length 0
11:15:40.457416 IP ec2-99-80-22-207.eu-west-1.compute.amazonaws.com.https > 172.16.146.2.57236: Flags [.], ack 37, win 118, options [nop,nop,TS val 65799068 ecr 1368866401], length 0
11:15:40.458582 IP ec2-99-80-22-207.eu-west-1.compute.amazonaws.com.https > 172.16.146.2.57236: Flags [P.], seq 34:65, ack 37, win 118, options [nop,nop,TS val 65799068 ecr 1368866401], length 31
11:15:40.458599 IP 172.16.146.2.57236 > ec2-99-80-22-207.eu-west-1.compute.amazonaws.com.https: Flags [.], ack 1, win 501, options [nop,nop,TS val 1368866538 ecr 65799068,nop,nop,sack 1 {34:65}], length 0
11:15:40.458643 IP ec2-99-80-22-207.eu-west-1.compute.amazonaws.com.https > 172.16.146.2.57236: Flags [P.], seq 1:34, ack 37, win 118, options [nop,nop,TS val 65799068 ecr 1368866401], length 33
11:15:40.458655 IP 172.16.146.2.57236 > ec2-99-80-22-207.eu-west-1.compute.amazonaws.com.https: Flags [.], ack 65, win 501, options [nop,nop,TS val 1368866538 ecr 65799068], length 0
11:15:40.458915 IP 172.16.146.2.57236 > ec2-99-80-22-207.eu-west-1.compute.amazonaws.com.https: Flags [P.], seq 37:68, ack 65, win 501, options [nop,nop,TS val 1368866539 ecr 65799068], length 31
11:15:40.458964 IP 172.16.146.2.57236 > ec2-99-80-22-207.eu-west-1.compute.amazonaws.com.https: Flags [F.], seq 68, ack 65, win 501, options [nop,nop,TS val 1368866539 ecr 65799068], length 0
This will read the capture stored in output.pcap. Notice it is back to a basic view. To get more detailed information out of the capture file, reapply our switches.
Fundamentals Lab
The purpose of this lab is to expose us to tcpdump and give us time to familiarize ourselves with the terminal and utilizing tools within it. We will practice various tcpdump basics such as reading from and writing to files, utilizing basic switches, and locating files in the terminal. While completing these labs, we can explore and practice using different switches and functionality within tcpdump. When comfortable, take some time and try to determine if we can make out any traffic visible to us on the network.
Keep in mind that this type of work is often used to examine specific hosts and servers in more detail and find out who they all interact with. This procedure can also be used to identify so-called backdoors or other potential breaches. This could be used to monitor and log all communication from one server to analyze the packets sent and received. For the analysis itself, we then use various filters and patterns to filter out suspicious packets. We will look at this in another section.
As the new network administrator for the Corporation, we have been tasked with capturing some network traffic to help baseline and validate the Corporation's network. As a test, we start utilizing tcpdump to get a small capture of our local broadcast domain traffic to ensure our capture device will work to accomplish this task. We need to ensure the tools and dependencies required are installed and test our ability to read traffic and capture it to a file.
If you wish to take a more exploratory approach to this lab, I have posted the overall tasks to accomplish. For a more detailed walkthrough of how to complete each step, look below each task in the solution bubble.
Tasks
Task #1
Validate Tcpdump is installed on our machine.
Before we can get started, ensure we have tcpdump installed. What command do we use to determine if tcpdump is installed on Linux?
Task #2
Start a capture.
Once we know tcpdump is installed, we are ready to start our first capture. If we are unsure of what interfaces we have to listen from, we can utilize a built-in switch to list them all for us.
Which tcpdump switch is used to show us all possible interfaces we can listen to?
Task #3
Utilize Basic Capture Filters.
Now that we can capture traffic, let us modify how that information is presented to us. We will accomplish this by adding verbosity to our output and displaying contents in ASCII and Hex. Once we complete this task, attempt it again using other switches.
Disable name resolution and display relative sequence numbers for another challenge.
Task #4
Save a Capture to a .PCAP file.
Now it is up to us how we wish to capture and see the output. Remember, when utilizing capture filters, it will modify what we get. Grab our first full capture from the wire, and save it to a PCAP file. This will be a sample to baseline the enterprise network.