To effectively manage their network, an organization should maintain (and continuously update) an asset inventory that includes all network-connected devices (servers, workstations, network appliances, etc.), installed software, and applications in use across the environment. If an organization is unsure what is present on its network, how will it know what to protect and what potential holes exist? The organization should know if applications are installed locally or hosted by a third party, their current patch level, if they are at or nearing end-of-life, be able to detect any rogue applications in the network (or "shadow IT"), and have enough visibility into each application to ensure that they are adequately secured with strong (non-default) passwords, and ideally, multi-factor authentication is enabled. Certain applications have administrative portals that can be restricted to only being accessible from specific IP addresses or the host itself (localhost).
The reality is that many organizations do not know everything on their network, and some organizations have very little visibility, and we can help them with this. The enumeration that we perform can be highly beneficial to our clients to help them enhance or start building an asset inventory. We may very likely identify applications that have been forgotten, demo versions of software that perhaps have had their trial license expired and converted to a version that does not require authentication (in the case of Splunk), applications with default/weak credentials, unauthorized/misconfigured applications, and applications that suffer from public vulnerabilities. We can provide this data to our clients as a combination of the findings in our reports (i.e., an application with default credentials admin:admin, as appendices such as a list of identified services mapped to hosts, or supplemental scan data). We can even take it a step further and educate our clients on some of the tools that we use daily so they can begin to perform periodic and proactive recon of their networks and find gaps before penetration testers, or worse, attackers, find them first.
As penetration testers, we need to have strong enumeration skills and be able to get the "lay of the land" on any network starting with very little to no information (black box discovery or just a set of CIDR ranges). Typically, when we connect to a network, we'll start with a ping sweep to identify "live hosts." From there, we will usually begin targeted port scanning and, eventually, deeper port scanning to identify running services. In a network with hundreds or thousands of hosts, this enumeration data can become unwieldy. Let's say we perform an Nmap port scan to identify common web services such as:
Nmap - Web Discovery
sasorirose@htb[/htb]$ nmap -p 80,443,8000,8080,8180,8888,10000 --open -oA web_discovery -iL scope_listWe may find an enormous amount of hosts with services running on ports 80 and 443 alone. What do we do with this data? Sifting through the enumeration data by hand in a large environment would be far too time-consuming, especially since most assessments are under strict time constraints. Browsing to each IP/hostname + port would also be highly inefficient.
Lucky for us, several great tools exist that can greatly assist in this process. Two phenomenal tools that every tester should have in their arsenal are EyeWitness and Aquatone. Both of these tools can be fed raw Nmap XML scan output (Aquatone can also take Masscan XML; EyeWitness can take Nessus XML output) and be used to quickly inspect all hosts running web applications and take screenshots of each. The screenshots are then assembled into a report that we can work through in the web browser to assess the web attack surface.
These screenshots can help us narrow down potentially 100s of hosts and build a more targeted list of applications that we should spend more time enumerating and attacking. These tools are available for both Windows and Linux, so we can utilize them on whatever we choose for our attack box in a given environment. Let's walk through some examples of each to create an inventory of applications present in the target INLANEFREIGHT.LOCAL domain.
Getting Organized
Though we will cover notetaking, reporting, and documentation in a separate module, it is worth taking the opportunity to select a notetaking application if we haven't done so and begin setting it up to best record the data we are gathering in this phase. The module Getting Started discusses several notetaking applications. If you have not chosen one at this point, it would be an excellent time to start. Tools like OneNote, Evernote, Notion, Cherrytree, etc., are all good options, and it comes down to personal preference. Regardless of the tool you choose, we should be working on our notetaking methodology at this point and be creating templates that we can use in our tool of choice set up for every assessment type.
For this section, I would break down the Enumeration & Discovery section of my notebook into a separate Application Discovery section. Here I would create subsections for the scope, scans (Nmap, Nessus, Masscan, etc.), application screenshotting, and interesting/notable hosts to dig more into later. It is important to time and date stamp every scan that we perform and save all output and the exact scan syntax that was performed and the targeted hosts. This can be useful later on if the client has any questions about the activity they saw during the assessment. Being organized from the start and keeping detailed logs and notes will help us greatly with the final report. I typically set up the skeleton of the report at the beginning of the assessment along with my notebook so I can begin filling in certain sections of the report while waiting for a scan to finish. All of this will save time at the end of the engagement, leave us more time for the fun stuff (testing misconfigurations and exploits!), and ensure that we are as thorough as possible.
An example OneNote (also applicable to other tools) structure may look like the following for the discovery phase:
External Penetration Test -
- Scope (including in-scope IP addresses/ranges, URLs, any fragile hosts, testing timeframes, and any limitations or other relative information we need handy)
- Client Points of Contact
- Credentials
- Discovery/Enumeration
- Application Discovery
- Exploitation
- Post-Exploitation
We will refer back to this structure throughout the module, so it would be a very beneficial exercise to replicate this and record all of our work on this module as if we were working through an actual engagement. This will help us refine our documentation methodology, an essential skill for a successful penetration tester. Having notes to refer back to from each section will be helpful when we get to the three skills assessments at the end of the module and will be extremely helpful as we progress in the Penetration Tester path.
Initial Enumeration
Let's assume our client provided us with the following scope:
sasorirose@htb[/htb]$ cat scope_list

app.inlanefreight.local
dev.inlanefreight.local
drupal-dev.inlanefreight.local
drupal-qa.inlanefreight.local
drupal-acc.inlanefreight.local
drupal.inlanefreight.local
blog-dev.inlanefreight.local
blog.inlanefreight.local
app-dev.inlanefreight.local
jenkins-dev.inlanefreight.local
jenkins.inlanefreight.local
web01.inlanefreight.local
gitlab-dev.inlanefreight.local
gitlab.inlanefreight.local
support-dev.inlanefreight.local
support.inlanefreight.local
inlanefreight.local
10.129.201.50
We can start with an Nmap scan of common web ports. I'll typically do an initial scan with ports 80,443,8000,8080,8180,8888,10000 and then run either EyeWitness or Aquatone (or both depending on the results of the first) against this initial scan. While reviewing the screenshot report of the most common ports, I may run a more thorough Nmap scan against the top 10,000 ports or all TCP ports, depending on the size of the scope. Since enumeration is an iterative process, we will run a web screenshotting tool against any subsequent Nmap scans we perform to ensure maximum coverage.
On a non-evasive full scope penetration test, I will usually run a Nessus scan too to give the client the most bang for their buck, but we must be able to perform assessments without relying on scanning tools. Even though most assessments are time-limited (and often not scoped appropriately for the size of the environment), we can provide our clients maximum value by establishing a repeatable and thorough enumeration methodology that can be applied to all environments we cover. We need to be efficient during the information gathering/discovery stage while not taking shortcuts that could leave critical flaws undiscovered. Everyone's methodology and preferred tools will vary a bit, and we should strive to create one that works well for us while still arriving at the same end goal.
All scans we perform during a non-evasive engagement are to gather data as inputs to our manual validation and manual testing process. We should not rely solely on scanners as the human element in penetration testing is essential. We often find the most unique and severe vulnerabilities and misconfigurations only through thorough manual testing.
Let's dig into the scope list mentioned above with an Nmap scan that will typically discover most web applications in an environment. We will, of course, perform deeper scans later on, but this will give us a good starting point.
Note: Not all hosts in the scope list above will be accessible when spawning the target below. There will be separate, similar, exercises at the end of this section in order to reproduce much of what is shown here.
sasorirose@htb[/htb]$ sudo  nmap -p 80,443,8000,8080,8180,8888,10000 --open -oA web_discovery -iL scope_list

Starting Nmap 7.80 ( https://nmap.org ) at 2021-09-07 21:49 EDT
Stats: 0:00:07 elapsed; 1 hosts completed (4 up), 4 undergoing SYN Stealth Scan
SYN Stealth Scan Timing: About 81.24% done; ETC: 21:49 (0:00:01 remaining)

Nmap scan report for app.inlanefreight.local (10.129.42.195)
Host is up (0.12s latency).
Not shown: 998 closed ports
PORT   STATE SERVICE
22/tcp open  ssh
80/tcp open  http

Nmap scan report for app-dev.inlanefreight.local (10.129.201.58)
Host is up (0.12s latency).
Not shown: 993 closed ports
PORT     STATE SERVICE
22/tcp   open  ssh
80/tcp   open  http
8000/tcp open  http-alt
8009/tcp open  ajp13
8080/tcp open  http-proxy
8180/tcp open  unknown
8888/tcp open  sun-answerbook

Nmap scan report for gitlab-dev.inlanefreight.local (10.129.201.88)
Host is up (0.12s latency).
Not shown: 997 closed ports
PORT     STATE SERVICE
22/tcp   open  ssh
80/tcp   open  http
8081/tcp open  blackice-icecap

Nmap scan report for 10.129.201.50
Host is up (0.13s latency).
Not shown: 991 closed ports
PORT     STATE SERVICE
80/tcp   open  http
135/tcp  open  msrpc
139/tcp  open  netbios-ssn
445/tcp  open  microsoft-ds
3389/tcp open  ms-wbt-server
5357/tcp open  wsdapi
8000/tcp open  http-alt
8080/tcp open  http-proxy
8089/tcp open  unknown
As we can see, we identified several hosts running web servers on various ports. From the results, we can infer that one of the hosts is Windows and the remainder are Linux (but cannot be 100% certain at this stage). Pay particularly close attention to the hostnames as well. In this lab, we are utilizing Vhosts to simulate the subdomains of a company. Hosts with dev as part of the FQDN are worth noting down as they may be running untested features or have things like debug mode enabled. Sometimes the hostnames won't tell us too much, such as app.inlanefreight.local. We can infer that it is an application server but would need to perform further enumeration to identify which application(s) are running on it.
We would also want to add gitlab-dev.inlanefreight.local to our "interesting hosts" list to dig into once we complete the discovery phase. We may be able to access public Git repos that could contain sensitive information such as credentials or clues that may lead us to other subdomains/Vhosts. It is not uncommon to find Gitlab instances that allow us to register a user without requiring admin approval to activate the account. We may find additional repos after logging in. It would also be worth checking previous commits for data such as credentials which we will cover more in detail later in this module when we dig deeper into Gitlab.
Enumerating one of the hosts further using an Nmap service scan (-sV) against the default top 1,000 ports can tell us more about what is running on the webserver.
sasorirose@htb[/htb]$ sudo nmap --open -sV 10.129.201.50

Starting Nmap 7.80 ( https://nmap.org ) at 2021-09-07 21:58 EDT
Nmap scan report for 10.129.201.50
Host is up (0.13s latency).
Not shown: 991 closed ports
PORT     STATE SERVICE       VERSION
80/tcp   open  http          Microsoft IIS httpd 10.0
135/tcp  open  msrpc         Microsoft Windows RPC
139/tcp  open  netbios-ssn   Microsoft Windows netbios-ssn
445/tcp  open  microsoft-ds?
3389/tcp open  ms-wbt-server Microsoft Terminal Services
5357/tcp open  http          Microsoft HTTPAPI httpd 2.0 (SSDP/UPnP)
8000/tcp open  http          Splunkd httpd
8080/tcp open  http          Indy httpd 17.3.33.2830 (Paessler PRTG bandwidth monitor)
8089/tcp open  ssl/http      Splunkd httpd (free license; remote login disabled)
Service Info: OS: Windows; CPE: cpe:/o:microsoft:windows

Service detection performed. Please report any incorrect results at https://nmap.org/submit/ .
Nmap done: 1 IP address (1 host up) scanned in 38.63 seconds
From the output above, we can see that an IIS web server is running on the default port 80, and it appears that Splunk is running on port 8000/8089, while PRTG Network Monitor is present on port 8080. If we were in a medium to large-sized environment, this type of enumeration would be inefficient. It could result in us missing a web application that may prove critical to the engagement's success.
Using EyeWitness
First up is EyeWitness. As mentioned before, EyeWitness can take the XML output from both Nmap and Nessus and create a report with screenshots of each web application present on the various ports using Selenium. It will also take things a step further and categorize the applications where possible, fingerprint them, and suggest default credentials based on the application. It can also be given a list of IP addresses and URLs and be told to pre-pend http:// and https:// to the front of each. It will perform DNS resolution for IPs and can be given a specific set of ports to attempt to connect to and screenshot.
We can install EyeWitness via apt:
sasorirose@htb[/htb]$ sudo apt install eyewitnessor clone the repository, navigate to the Python/setup directory and run the setup.sh installer script. EyeWitness can also be run from a Docker container, and a Windows version is available, which can be compiled using Visual Studio.
Running eyewitness -h will show us the options available to us:
sasorirose@htb[/htb]$ eyewitness -h

usage: EyeWitness.py [--web] [-f Filename] [-x Filename.xml]
                     [--single Single URL] [--no-dns] [--timeout Timeout]
                     [--jitter # of Seconds] [--delay # of Seconds]
                     [--threads # of Threads]
                     [--max-retries Max retries on a timeout]
                     [-d Directory Name] [--results Hosts Per Page]
                     [--no-prompt] [--user-agent User Agent]
                     [--difference Difference Threshold]
                     [--proxy-ip 127.0.0.1] [--proxy-port 8080]
                     [--proxy-type socks5] [--show-selenium] [--resolve]
                     [--add-http-ports ADD_HTTP_PORTS]
                     [--add-https-ports ADD_HTTPS_PORTS]
                     [--only-ports ONLY_PORTS] [--prepend-https]
                     [--selenium-log-path SELENIUM_LOG_PATH] [--resume ew.db]
                     [--ocr]

EyeWitness is a tool used to capture screenshots from a list of URLs

Protocols:
  --web                 HTTP Screenshot using Selenium

Input Options:
  -f Filename           Line-separated file containing URLs to capture
  -x Filename.xml       Nmap XML or .Nessus file
  --single Single URL   Single URL/Host to capture
  --no-dns              Skip DNS resolution when connecting to websites

Timing Options:
  --timeout Timeout     Maximum number of seconds to wait while requesting a
                        web page (Default: 7)
  --jitter # of Seconds
                        Randomize URLs and add a random delay between requests
  --delay # of Seconds  Delay between the opening of the navigator and taking
                        the screenshot
  --threads # of Threads
                        Number of threads to use while using file based input
  --max-retries Max retries on a timeout
                        Max retries on timeouts
Let's run the default --web option to take screenshots using the Nmap XML output from the discovery scan as input.
sasorirose@htb[/htb]$ eyewitness --web -x web_discovery.xml -d inlanefreight_eyewitness

################################################################################
#                                  EyeWitness                                  #
################################################################################
#           FortyNorth Security - https://www.fortynorthsecurity.com           #
################################################################################

Starting Web Requests (26 Hosts)
Attempting to screenshot http://app.inlanefreight.local
Attempting to screenshot http://app-dev.inlanefreight.local
Attempting to screenshot http://app-dev.inlanefreight.local:8000
Attempting to screenshot http://app-dev.inlanefreight.local:8080
Attempting to screenshot http://gitlab-dev.inlanefreight.local
Attempting to screenshot http://10.129.201.50
Attempting to screenshot http://10.129.201.50:8000
Attempting to screenshot http://10.129.201.50:8080
Attempting to screenshot http://dev.inlanefreight.local
Attempting to screenshot http://jenkins-dev.inlanefreight.local
Attempting to screenshot http://jenkins-dev.inlanefreight.local:8000
Attempting to screenshot http://jenkins-dev.inlanefreight.local:8080
Attempting to screenshot http://support-dev.inlanefreight.local
Attempting to screenshot http://drupal-dev.inlanefreight.local
[*] Hit timeout limit when connecting to http://10.129.201.50:8000, retrying
Attempting to screenshot http://jenkins.inlanefreight.local
Attempting to screenshot http://jenkins.inlanefreight.local:8000
Attempting to screenshot http://jenkins.inlanefreight.local:8080
Attempting to screenshot http://support.inlanefreight.local
[*] Completed 15 out of 26 services
Attempting to screenshot http://drupal-qa.inlanefreight.local
Attempting to screenshot http://web01.inlanefreight.local
Attempting to screenshot http://web01.inlanefreight.local:8000
Attempting to screenshot http://web01.inlanefreight.local:8080
Attempting to screenshot http://inlanefreight.local
Attempting to screenshot http://drupal-acc.inlanefreight.local
Attempting to screenshot http://drupal.inlanefreight.local
Attempting to screenshot http://blog-dev.inlanefreight.local
Finished in 57.859838008880615 seconds

[*] Done! Report written in the /home/mrb3n/Projects/inlanfreight/inlanefreight_eyewitness folder!
Would you like to open the report now? [Y/n]
Using Aquatone
Aquatone, as mentioned before, is similar to EyeWitness and can take screenshots when provided a .txt file of hosts or an Nmap .xml file with the -nmap flag. We can compile Aquatone on our own or download a precompiled binary. After downloading the binary, we just need to extract it, and we are ready to go.
Note: Aquatone is currently under active development in a new fork, focusing on improvements and feature enhancements. Refer to the installation guide provided in the repository.
sasorirose@htb[/htb]$ wget https://github.com/michenriksen/aquatone/releases/download/v1.7.0/aquatone_linux_amd64_1.7.0.zipsasorirose@htb[/htb]$ unzip aquatone_linux_amd64_1.7.0.zip
Archive: aquatone_linux_amd64_1.7.0.zip
inflating: aquatone
inflating: README.md
inflating: LICENSE.txtWe can move it to a location in our $PATH such as /usr/local/bin to be able to call the tool from anywhere or just drop the binary in our working (say, scans) directory. It's personal preference but typically most efficient to build our attack VMs with most tools available to use without having to constantly change directories or call them from other directories.
sasorirose@htb[/htb]$ echo $PATH

/home/mrb3n/.local/bin:/snap/bin:/usr/sandbox/:/usr/local/bin:/usr/bin:/bin:/usr/local/games:/usr/games:/usr/share/games:/usr/local/sbin:/usr/sbin:/sbin:/usr/local/bin:/usr/bin:/bin:/usr/local/games:/usr/games
In this example, we provide the tool the same web_discovery.xml Nmap output specifying the -nmap flag, and we're off to the races.
sasorirose@htb[/htb]$ cat web_discovery.xml | ./aquatone -nmap
aquatone v1.7.0 started at 2021-09-07T22:31:03-04:00
Targets : 65
Threads : 6
Ports : 80, 443, 8000, 8080, 8443
Output dir : .
http://web01.inlanefreight.local:8000/: 403 Forbidden
http://app.inlanefreight.local/: 200 OK
http://jenkins.inlanefreight.local/: 403 Forbidden
http://app-dev.inlanefreight.local/: 200
http://app-dev.inlanefreight.local/: 200
http://app-dev.inlanefreight.local:8000/: 403 Forbidden
http://jenkins.inlanefreight.local:8000/: 403 Forbidden
http://web01.inlanefreight.local:8080/: 200
http://app-dev.inlanefreight.local:8000/: 403 Forbidden
http://10.129.201.50:8000/: 200 OK
http://web01.inlanefreight.local:8000/: screenshot successful
http://app.inlanefreight.local/: screenshot successful
http://app-dev.inlanefreight.local/: screenshot successful
http://jenkins.inlanefreight.local/: screenshot successful
http://app-dev.inlanefreight.local/: screenshot successful
http://app-dev.inlanefreight.local:8000/: screenshot successful
http://jenkins.inlanefreight.local:8000/: screenshot successful
http://app-dev.inlanefreight.local:8000/: screenshot successful
http://app-dev.inlanefreight.local:8080/: screenshot successful
http://app.inlanefreight.local/: screenshot successful
Calculating page structures... done
Clustering similar pages... done
Generating HTML report... done
Writing session file...Time:
- Started at : 2021-09-07T22:31:03-04:00
- Finished at : 2021-09-07T22:31:36-04:00
- Duration : 33s
Requests:
- Successful : 65
- Failed : 0
- 2xx : 47
- 3xx : 0
- 4xx : 18
- 5xx : 0
Screenshots:
- Successful : 65
- Failed : 0
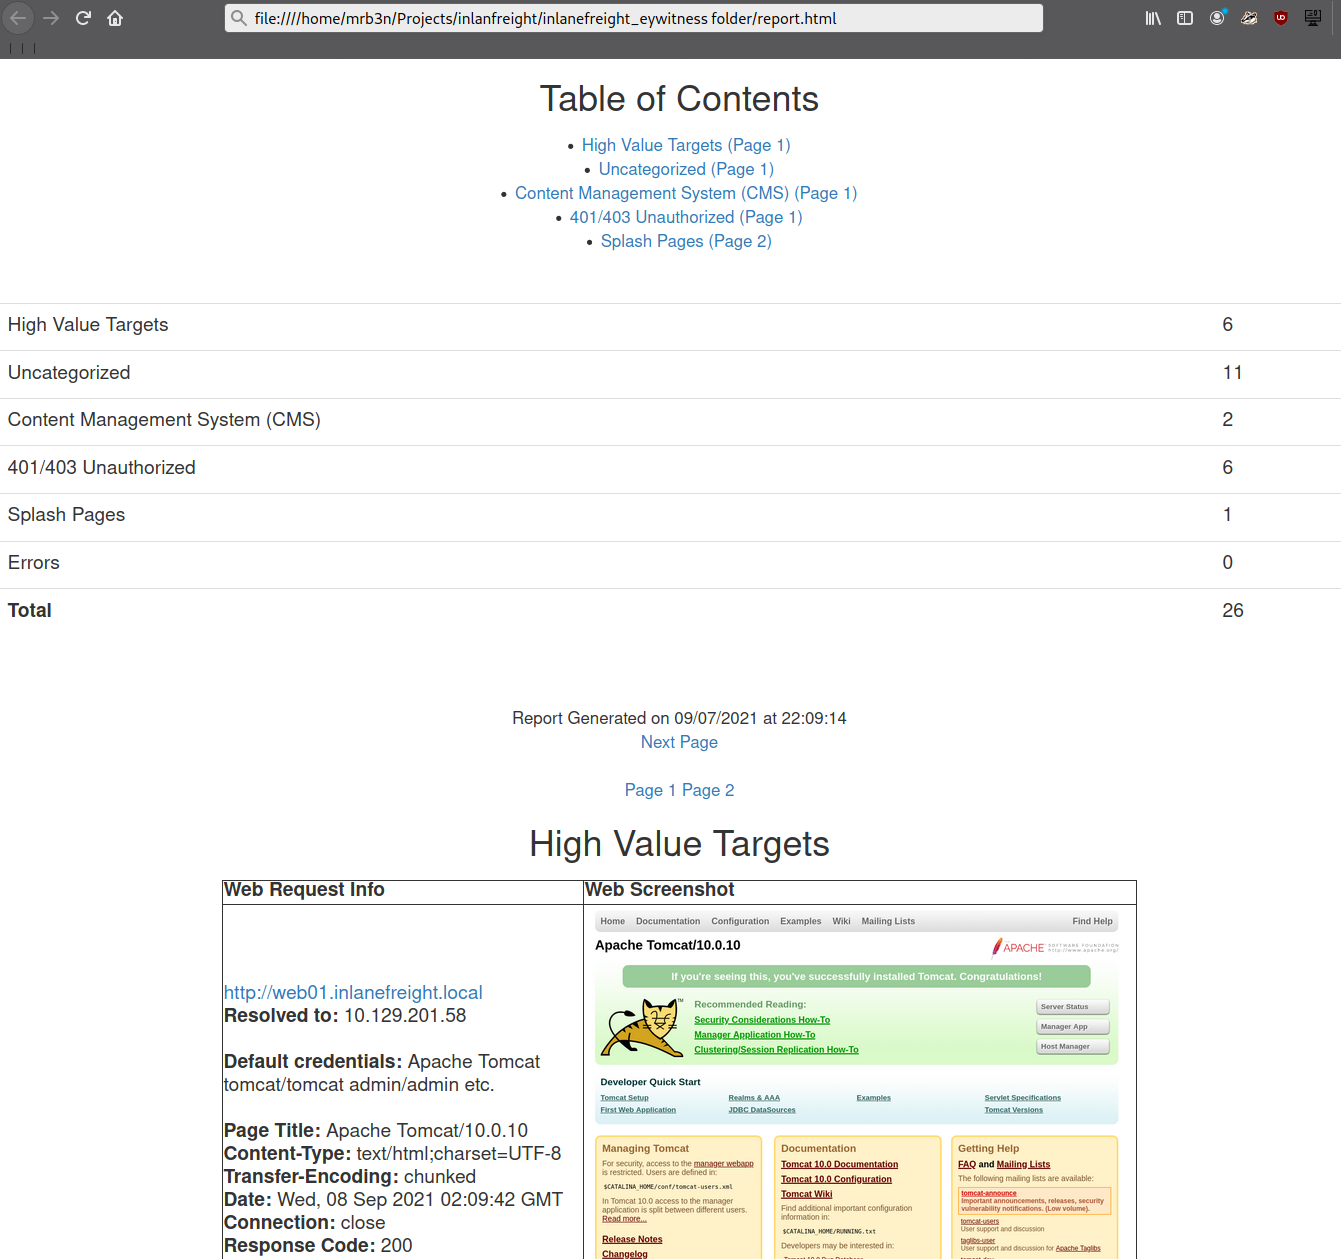
Wrote HTML report to: aquatone_report.html Interpreting the Results
Even with the 26 hosts above, this report will save us time. Now imagine an environment with 500 or 5,000 hosts! After opening the report, we see that the report is organized into categories, with High Value Targets being first and typically the most "juicy" hosts to go after. I have run EyeWitness in very large environments and generated reports with hundreds of pages that take hours to go through. Often, the very large reports will have interesting hosts buried deep within them, so it is worth reviewing the entire thing and poking at/researching any applications we are unfamiliar with. I found the ManageEngine OpManager application mentioned in the introduction section buried deep into a very large report during an external penetration test. This instance was left configured with the default credentials admin:admin and left wide open to the internet. I was able to log in and achieve code execution by running a PowerShell script. The OpManager application was running in the context of a Domain Admin account which led to full compromise of the internal network.
In the below report, I would be immediately excited to see Tomcat on any assessment (but especially during an External Penetration Test) and would try default credentials on the /manager and /host-manager endpoints. If we can access either, we can upload a malicious WAR file and achieve remote code execution on the underlying host using JSP code. More on this later in the module.
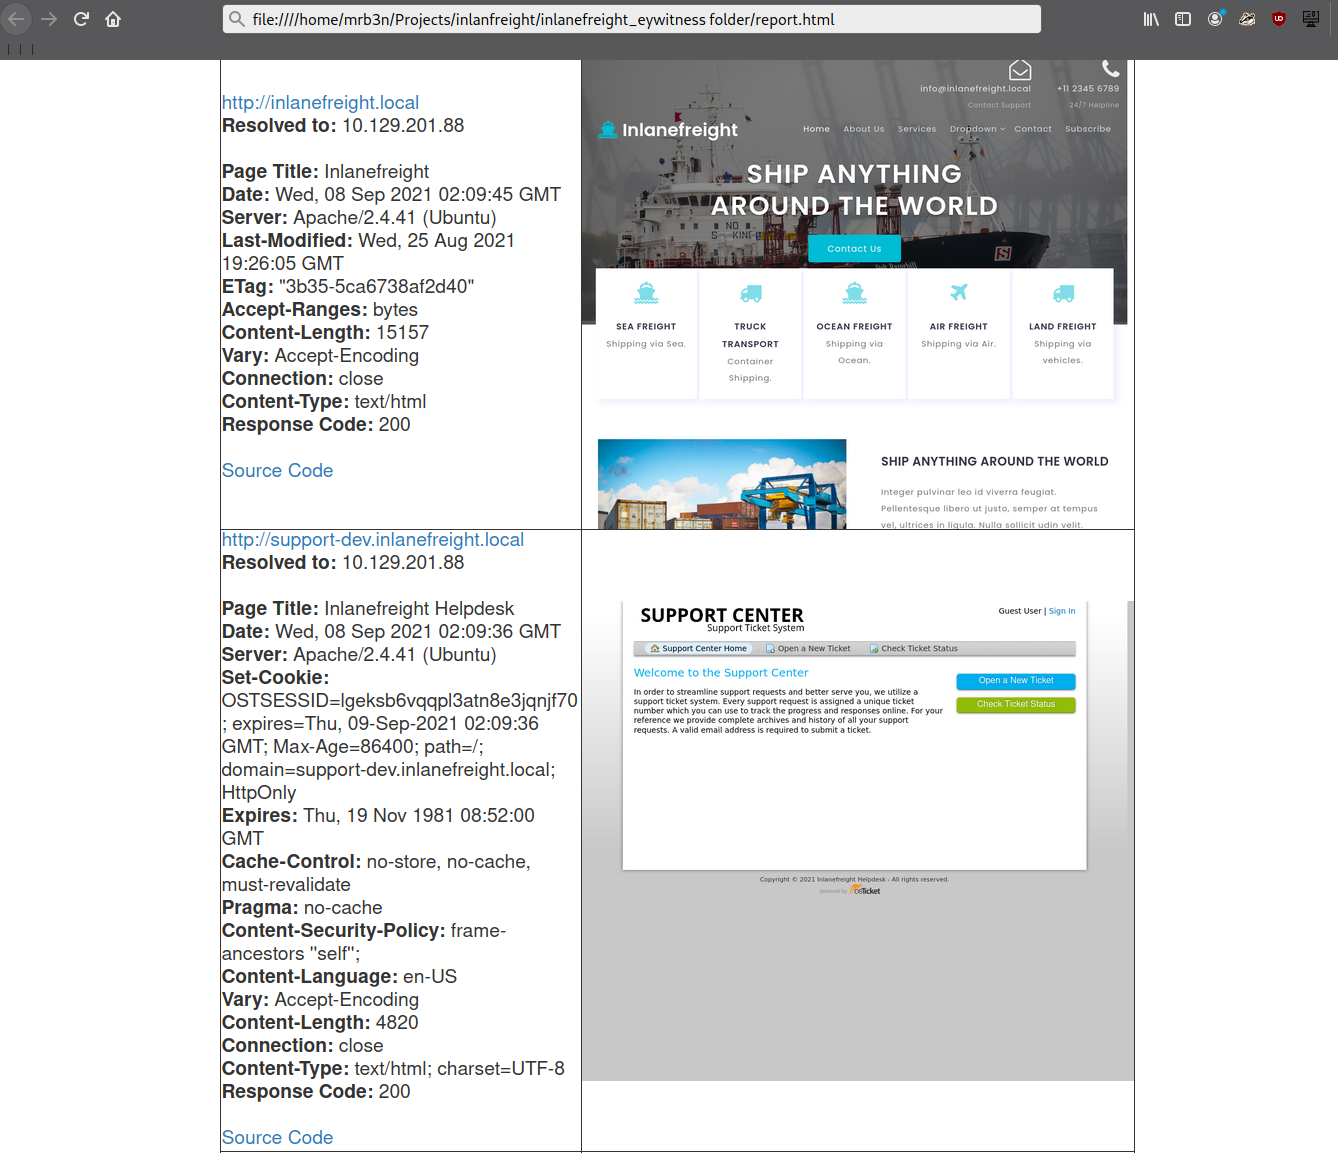
Continuing through the report, it looks like the main http://inlanefreight.local website is next. Custom web applications are always worth testing as they may contain a wide variety of vulnerabilities. Here I would also be interested to see if the website was running a popular CMS such as WordPress, Joomla, or Drupal. The next application, http://support-dev.inlanefreight.local, is interesting because it appears to be running osTicket, which has suffered from various severe vulnerabilities over the years. Support ticketing systems are of particular interest because we may be able to log in and gain access to sensitive information. If social engineering is in scope, we may be able to interact with customer support personnel or even manipulate the system to register a valid email address for the company's domain which we may be able to leverage to gain access to other services.
This last piece was demonstrated in the HTB weekly release box Delivery by IppSec. This particular box is worth studying as it shows what is possible by exploring the built-in functionality of certain common applications. We will cover osTicket more in-depth later in this module.
During an assessment, I would continue reviewing the report, noting down interesting hosts, including the URL and application name/version for later. It is important at this point to remember that we are still in the information gathering phase, and every little detail could make or break our assessment. We should not get careless and begin attacking hosts right away, as we may end up down a rabbit hole and miss something crucial later in the report. During an External Penetration Test, I would expect to see a mix of custom applications, some CMS, perhaps applications such as Tomcat, Jenkins, and Splunk, remote access portals such as Remote Desktop Services (RDS), SSL VPN endpoints, Outlook Web Access (OWA), O365, perhaps some sort of edge network device login page, etc.
Your mileage may vary, and sometimes we will come across applications that absolutely should not be exposed, such as a single page with a file upload button I encountered once with a message that stated, "Please only upload .zip and .tar.gz files". I, of course, did not heed this warning (as this was in-scope during a client-sanctioned penetration test) and proceeded to upload a test .aspx file. To my surprise, there was no sort of client-side or back-end validation, and the file appeared to upload. Doing some quick directory brute-forcing, I was able to locate a /files directory that had directory listing enabled, and my test.aspx file was there. From here, I proceeded to upload a .aspx web shell and gained a foothold into the internal environment. This example shows that we should leave no stone unturned and that there can be an absolute treasure trove of data for us in our application discovery data.
During an Internal Penetration Test, we will see much of the same but often also see many printer login pages (which we can sometimes leverage to obtain cleartext LDAP credentials), ESXi and vCenter login portals, iLO and iDRAC login pages, a plethora of network devices, IoT devices, IP phones, internal code repositories, SharePoint and custom intranet portals, security appliances, and much more.
Moving On
Now that we've worked through our application discovery methodology and set up our notetaking structure let's deep dive into some of the most common applications that we will encounter time and time again. Please note that this module cannot possibly cover every single application that we will face. Rather, we aim to cover very prevalent ones and learn about common vulnerabilities, misconfigurations, and abusing their built-in functionality.
I can guarantee that you will face at least a few, if not all, of these applications during your career as a penetration tester. The methodology and mindset of exploring these applications are even more important, which we will develop and enhance throughout this module and test out during the skills assessments at the end. Many testers have great technical skills but soft skills such as a sound, and repeatable, methodology along with organization, attention to detail, strong communication, and thorough notetaking/documentation and reporting can set us apart and help to build confidence in our skillsets from both our employers as well as our clients.
Questions:
Use what you've learned from this section to generate a report with EyeWitness. What is the name of the .db file EyeWitness creates in the inlanefreight_eyewitness folder? (Format: filename.db)
Answer: ew.db
What does the header on the title page say when opening the aquatone_report.html page with a web browser? (Format: 3 words, case sensitive)
Answer: Page by Similarity